ALGOUSDT Facing a Major Reversal? Bears Ready to Take Over!Yello, Paradisers! Is ALGOUSDT about to take a sharp dive? The price is currently hovering around a key supply zone, struggling to push higher. With buyers failing to break through, the risk of a strong bearish rejection is increasing, signaling a potential short opportunity.
💎The market structure has shown a clear Change of Character (CHoCH), suggesting a shift from an uptrend to a potential downtrend. Price remains below the 50 EMA, reinforcing the bearish momentum. If sellers step in with force, the downside move could accelerate quickly.
💎Key downside targets are forming around 0.2188 and 0.1663, where the next major support zones lie. If the bearish scenario plays out, these levels could be reached sooner than expected. Any failure to reclaim higher levels will only strengthen the case for further declines.
This is where patience and discipline pay off. Market traps are everywhere, and only those who stay focused and trade smart will come out on top. Be ready for the move, Paradisers!
MyCryptoParadise
iFeel the success🌴
ALGOUSDT trade ideas

ALGOUSDT 1WALGO ~ 1W Analysis
#ALGO Buy from here if you still have a Conviction on this coin with a short -term target of at least 20%+.

ALGO Update: Spot/Futures Position & Potential Price ActionHey traders! 👋
Let’s take a quick look at Algorand (ALGO), which has been showing some interesting price action lately. 🇺🇸 As we know, ALGO has been closely tied to the broader market sentiment, and with all the attention around US-based projects, it’s definitely one to watch, especially with the current political landscape.
1️⃣ The Sell Signal – We received a strong sell signal earlier, and as a result, we decided to exit our spot position. Since then, we’ve been in a clear downtrend with lower lows and lower highs. 🔻
2️⃣ Fib Level 0.786 – Currently, we’re approaching the 0.786 Fibonacci level, which could act as a potential retracement point. Could this be the level where the market reverses? 🤔 If we see a bounce here, we might fill the demand zone and potentially add more spot positions.
However, there’s also the possibility of a breakout to the downside if the current downtrend continues. Will the bulls step in at this crucial point, or are we heading lower?
What do you think? 🤨 Drop your thoughts below and let’s discuss the next move! 💬 Don’t forget to follow for more insights on ALGO and other cryptos.
Happy trading, everyone! 💰📈

ALGOUSDT - a realistic target for bullshi traders,
The higher low may be in the making.
The chart still looks good. Still much better than many altcoins that made new lows.
If ALGO holds the higher lows structure, we should see 0,75-0,80$ this summer.
Don't be greedy. This is completely different market than in 2021.
Good luck

SPOT ALGO LONG 14.03.2025Pinning after abnormal purchases.
💰I enter at the market price.
I'll let you know when I record it manually.
‼️Risk per trade: 1% of the allocated funds for spot trading.
Thank you!

ALGORAND LONG IDEAhi all. today i will set up long position for algorand. because on weekly time frame it seems still bullish. and also USA centered cryptocurrency. i emphasize that because of national reserve issue..
entry : 0.2456
stop : 0.2035
target: minimum 0.48 area

ALGOUSDT - Weekly LONGThis is a weekly technical analysis for educational purposes on ALGOUSDT. I believe that Algo will revisit the same levels and will be widely discussed during the altcoin bull season. I may be wrong. :)
Regards,

ALGO buy setup (1D)Here, we have a high-potential zone for ALGO.
The green zone represents strong support, and if the price reaches this area, we will look for buy/long positions.
The red box is a fresh order block that hasn’t been tapped yet, containing the main sell orders.
The target can be this red box.
Closing a daily candle below the invalidation level will invalidate this analysis.
For risk management, please don't forget stop loss and capital management
Comment if you have any questions
Thank You

ALGO DAILY UPDATEALGO is a POS based blockchain.
ANY THOUGHTS ON EURONEXT:ALGO ?
Like THIS POST AND I WILL SHARE NEXT pair

ALGO USDT📈 #ALGO/USDT - Key Levels & Market Outlook 🚀
EURONEXT:ALGO has been in a downtrend, testing a key support zone around $0.2119.
Fibonacci retracement suggests a potential recovery if the price rebounds from support.
🎯 Price Targets
✅ (T1): $0.3999
✅ (T2): $0.5233
✅ (T3): $0.6445

#ALGO/USDT#ALGO
The price is moving in a descending channel on the 1-hour frame and is expected to continue upwards
We have a trend to stabilize above the moving average 100 again
We have a descending trend on the RSI indicator that supports the rise by breaking it upwards
We have a support area at the lower limit of the channel at a price of 0.2351
Entry price 0.2434
First target 0.2479
Second target 0.2536
Third target 0.2594

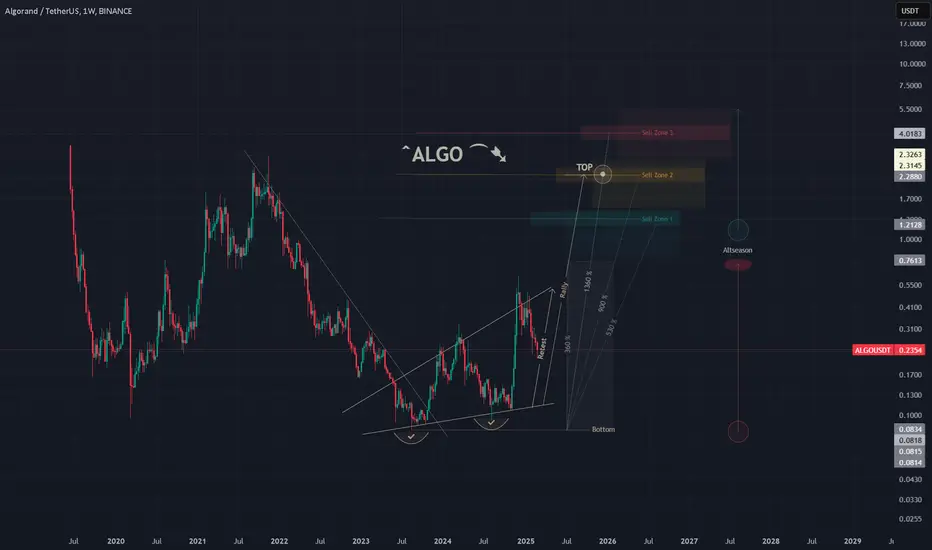
ALGO/USDT 1W🩸 EURONEXT:ALGO ⁀➷
#Algorand. Macro chart Another
💯 Intermediate Target - $0.76
🚩 Macro Target 1 - $1.21
🚩 Macro Target 2 - $2.28
🚩 Macro Target 3 - $4.01
- Not financial advice, trade with caution.
#Crypto #Algorand #ALGO #Investment
✅ Stay updated on market news and developments that may influence the price of Algorand. Positive or negative news can significantly impact the cryptocurrency's value.
✅ Exercise patience and discipline when executing your trading plan. Avoid making impulsive decisions driven by emotions, and adhere to your strategy even during periods of market volatility.
✅ Remember that trading always involves risk, and there are no guarantees of profit. Conduct thorough research, analyze market conditions, and be prepared for various scenarios. Trade only with funds you can afford to lose and avoid excessive risk-taking.
ALGO ANALYSIS (1D)ALGO's structure is still bullish on higher timeframes and will remain so unless the origin of the previous bullish wave is broken.
We have a low-risk Rebuy zone where spot entries can be made gradually within this range.
The target could be the supply zone.
A daily candle closing below the invalidation level would invalidate this analysis.
Do not enter the position without capital management and stop setting
Comment if you have any questions
thank you


$ALGOI consider two price ranges for the correction floor. The first range is around $0.1977, from which I suspect we might see a temporary bounce, but I believe this price range will not be the end of the price correction. The second range is around $0.1388, where I think we will see the end of the correction and a trend change. If the price reaches around the second range, the market will need a time correction. In the future, based on the events occurring in this dynamic market, a more comprehensive analysis will be provided. For now, my view on the EURONEXT:ALGO currency is as follows.
I would be pleased to see your valuable and constructive comments below this analysis. Thank you for taking the time to read this analysis. I hope you have enjoyed it.

Algorand scalp long to $0.271I just now opened a scalp long position on algorand. I anticipate the the market will continue to push towards $0.2710 resistance area.
Just looking to capture a small piece of the move real quick.
ONly downside about this trade is that I am entering now without confirmation as I would have gotten confirmation from an earlier entry. Am just taking the trade from what I think is a good key level that will hold...thats it

Algorand long to $0.2755 area now !I just went long on Algorand
Am targeting: $0.2755 area
2.8RR roughly
Time sensitive

ALGO bullish ideaLooking at the ALGO chart we can see that price has retraced a significant amount of the last pump. Sitting just above a major fib level (786) both on high time frame and low timeframe.
Showing possible long ideas if price continues to build bullish price action.
Note, need to align with BTC starting a bullish uptrend before having any conviction in any Alts doing likewise.
Target for these ideas will be the POC of the overall structure. Profits should be taken in layers (maybe 2-3 before the POC) to mitigate risk of BTC continuing downtrend.
Note, manage your risk. Possible for price to drop down to the next support level.

algo ready for distribution/pump.algousdt is in manipulation of po3 formation. Also their team is very active now a days and doing partnerships. which can also be a good factor to buy this.

ALGO Completes Bullish Harmonic PatternALGO Completes Bullish Harmonic Pattern
ALGO is currently testing a strong support zone that has held steady for about two weeks. From the chart, we can observe that ALGO has repeatedly tested the 0.2600 price zone and successfully bounced back each time.
It appears that market participants are determined to prevent the price from falling further. Today, ALGO completed a bullish harmonic pattern, adding more strength to the expected bullish movement from this zone.
Key resistance areas are identified near 0.2870, 0.2970, and 0.3060.
You may find more details in the chart!
Thank you and Good Luck!
❤️PS: Please support with a like or comment if you find this analysis useful for your trading day❤️

Is ALGO Finally Bottoming Out? A Massive Move Could Be Coming!Yello, Paradisers! #ALGOUSDT is flashing major reversal signals, and if the pattern plays out, a big move could be on the horizon. Are the bulls finally ready to step in? Let’s break it down!
💎#ALGO has been stuck in an A-B-C correction pattern, with Wave A kicking off the downtrend, Wave B bringing a retracement, and Wave C completing the correction. But here’s where it gets interesting—ALGO is now showing signs of accumulation, hinting that bulls might be gearing up for the next impulsive wave.
💎To confirm the reversal, ALGO must break the $0.33 resistance. If bulls successfully push past this level, momentum could accelerate, sending price toward the descending resistance at $0.37. This is a pivotal breakout level, and clearing it would give bulls the strength to aim for the $0.46–$0.50 resistance zone—the 61.8% Fibonacci retracement, a historically strong level where major reactions tend to happen.
💎On the downside, ALGO has solid support at $0.265–$0.250, a key demand zone that bulls have defended since November 2024. As long as this support holds, the probability of a strong move higher remains intact.
Paradisers, as always, patience and precision are key in this market. This isn’t a time for reckless trades—let the levels guide you, trade strategically, and stay disciplined.
MyCryptoParadise
iFeel the success🌴


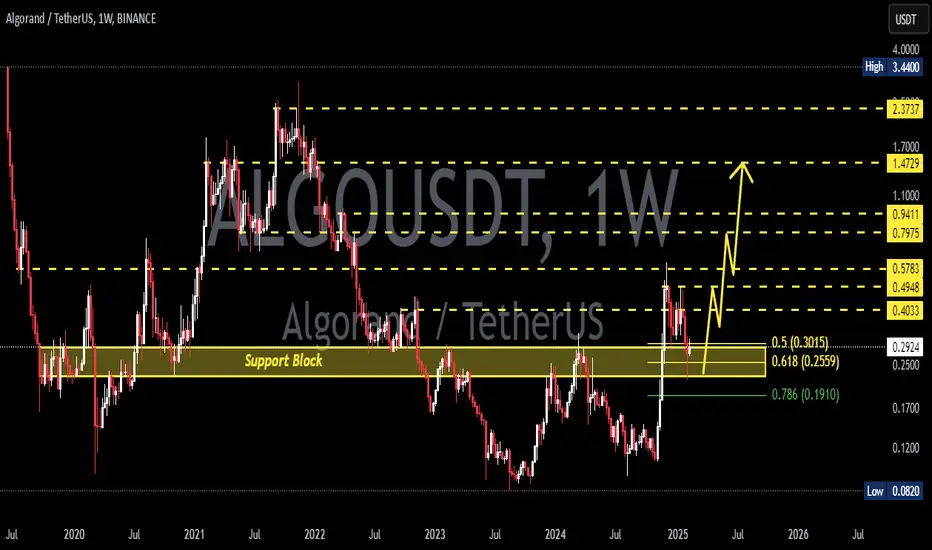
ALGOUSDT 1WALGO ~ 1W Analysis
#ALGO If you still have a Conviction on this coin. Maybe this is very good support to start buying again from here.