Algorand almost already to full invh&s breakout targetThe golden cross strikes again with an immediate blast off in algorand price as it is already getting very close to hitting the full inverse head and shoulder breakout target here. Zooming in here we ca more clearly see how the golden cross coincided with this blast off: *not financial advice*
ALGUSD trade ideas

Algorand (ALGO) Market AnalysisCurrent Market Conditions
As of December 2, 2024, Algorand (ALGO) is trading at approximately $0.48 USD, with a 24-hour trading volume of $1.96 billion USD. The cryptocurrency market is experiencing a period of moderate volatility.
Technical Analysis:
The ALGO/USDT chart is showing a potential breakout scenario. The price is currently consolidating below the 0.236 Fibonacci retracement level, which is acting as a resistance. A successful break above this level could trigger a significant price increase.
Key Levels to Watch:
- Resistance: 0.236 Fibonacci retracement level (approximately $0.53 USD)
- Support: 0.382 Fibonacci retracement level (approximately $0.38 USD)
- ATH: $3.28 USD (reached on June 21, 2019)
Market Sentiment:
The overall market sentiment for ALGO is bullish, with many traders and investors expecting a breakout above the 0.236 Fibonacci retracement level. A successful break could lead to a significant price increase, potentially reaching the ATH.
Trading Strategy:
- Long-term investors: Consider accumulating ALGO on dips, with a target price of $3.28 USD (ATH).
- Short-term traders: Watch for a breakout above the 0.236 Fibonacci retracement level (approximately $0.53 USD). If successful, consider entering a long position with a target price of $1.50 USD.
Risk Management
- Set stop-loss orders below the 0.382 Fibonacci retracement level (approximately $0.38 USD) to limit potential losses.
- Consider scaling into positions to manage risk and maximize potential gains.
By closely monitoring the ALGO/USDT chart and watching for a breakout above the 0.236 Fibonacci retracement level, traders and investors can potentially capitalize on a significant price increase and reach the ATH.

Algo possibly to 1$Algorand has finally caught an upward spike after being rather stable at its lowest value for close to 2 years.
In the current Alt market, people are looking for:
- Relatively small market cap
- Previous ATH to be much higher than current value
- A long stable bottom, but a good sign of upwards potential
Algo was tricky for a long time, skipping most of the upwards trend so far until now, exploding with a big move. This can also be worrisome as a correction usually follows big moves like this. Here is why I dont think a correction will actually follow:
- Trading volumes are mostly for buys above the 0.30$ mark
- Most volume was between 0.37-0.47, with a lot of selling happening there
It does seem like most people are just getting on the ride.
Things to be careful about:
- Algorand does not have the same amount of currency in circulation now as it did back in 2022
2022: 6.95B
2024: 8.3B
Which does mean that its nearing its full amount of market cap/currencies in circulation, but people have been staking Algo for a few years now and receiving Algo according to the release schedule. I expect people to partially sell as Algo hits the 0.70$ and the 1$ marks.
If you plan to hold Algo long term, careful not to buy too much above those numbers for now, as a large correction will be very likely.
Its not at all unlikely that Algo can print an ATH during this run, lets see what December brings us.
Good luck trading, and don't forget to place targets and stop losses.
And remember, this is not a financial advise, trade at your own risk.

ALGO LongALGO at a cross-roads? This is a monthly chart that's 1.5 hours old. I expect it to challenge the old trendline area. This is crypto though so charting is only guessing. I think up is our real direction. Likely buy $100 more if drop below $0.40. If not, have my bags and ready to ride. Stake much?

ALGO, the best ALT coin to hold? Yes! It's time for a FREE RUN! As expected ALGO is pushing and is not going to stop before $2.5!

Goldencross Once Again Having Immediate Impact;On Algo This TimeSo far my hypothesis that the golden cross responds immediately in the parabolic phase of the bull run is continuing to be proven correct as we see it happening again here now with algorand. Sending price already skyrocketing almost to the full inverse head and shoulders breakout target at .5050 *not financial advice*

Algorand mark up phase (Part 2)This is an addition to the ongoing macro trade idea from the spring phase low.
This whole structure here, looks to me like one long wyckoff accumulation campaign and Adam / Eve double bottom.
This is your sign of strength, and the expectation is to return to the range high, and likely see a partial decline or consolidation once achieved.
If i am correct here, we could expect eventual targets at the 100% measured move of the range, confluent with both the 1.618 extension of the spring correction, and a 4.236 of wave 1 coming up.
This is a weekly chart, this will take time and itll probably be a difficult hold, but if it continues to play out in this fashion, that will be my expectation until proven otherwise.

ALGOWish I bought way more! Watching next resistance line then WE off again. Bull runs we only buy pullbacks. Anything above 10% from most recent high is a gift.

ALGO Running out of steam for now.Looks we're topping the MACD for Friday 29th, It will cool off over the weekend then Monday go again from the low 33 range.
Volume is also picking up over the last week.

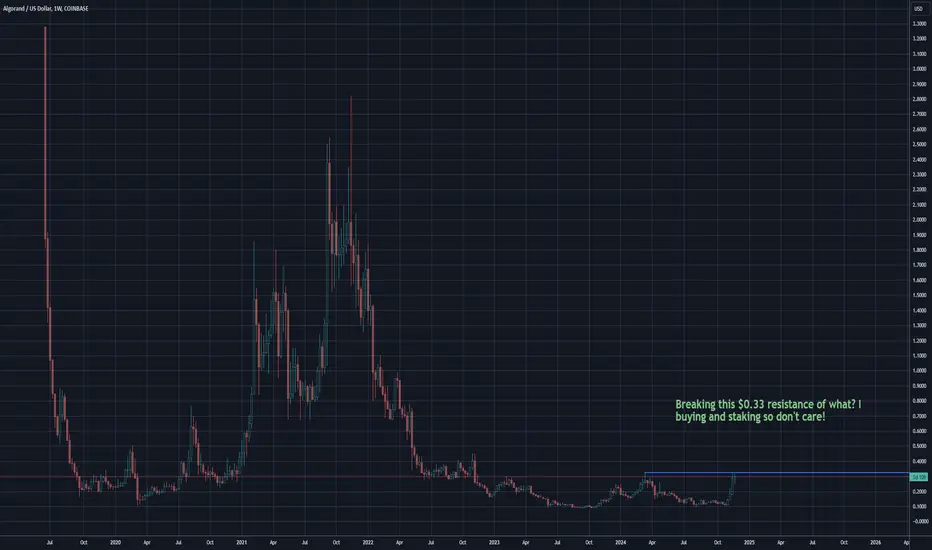
ALGO weekly primed for a move!The weekly price action for EURONEXT:ALGO looks great. Close to breakout of $0.33 range. Will be buying more for staking purposes. Like to govern this stuff not just trade for crappy $USD! HODL or whatever you want to call it.
ALGO long term viewBullish long term view for Algo. Following suite of other Alt coins. A lot of upside potential for these coins in 2025. Both technically and fundamentally with Trump being president and supporting cyrpto in general. Big year for these coins coming up

Algorand Current Market StructureGood Day Fellow Traders
The ALGO chart is currently exhibiting a short-term ABCD pattern, indicating a potential reversal or continuation. Throughout the last week, ALGO has demonstrated impressive gains, suggesting a robust bullish momentum.
Support and Double Bottom Confirmation
ALGO has found significant support at the $0.25 level, which is confirmed by a double bottom pattern. This support level serves as a crucial foundation for the potential bullish continuation.
ABCD Pattern and Point D Projection
The ABCD pattern suggests that ALGO might be cooling off temporarily before resuming its upward trajectory. If the pattern plays out, we can expect ALGO to reach Point D, which could mark the beginning of another bullish leg.
Bullish Continuation and Potential ATH
Upon reaching Point D, ALGO may experience a bullish resurgence, potentially leading to new all-time highs (ATH). The double bottom confirmation and the ABCD pattern suggest that ALGO is poised for a continuation of its uptrend.
Conclusion
In conclusion, the Algorand chart is exhibiting a short-term ABCD pattern, indicating a potential bullish continuation. The double bottom confirmation at $0.25 provides a solid support level, and reaching Point D could mark the beginning of another upward leg. As ALGO cools off temporarily, it may be preparing for a more significant bullish move, potentially leading to new all-time highs.


ALGOUSD Macro BreakoutMacro Breakout, with long time frames taking over. I'm pretty bullish, and Algrand's tech is some of the best out there! If we get a week closing .33, that's confirmation on the upside.

#ALGORAND Vs #ETH - When is Cheap actually a good entry buy.Losing Dollar Value is one thing.
But losing 94% in 2 years vs #Ethereum is a second type of pain
That highlights the risk that abounds in #Crypto and the #altcoins
Can #Algo start making positive progress now?

ALGORANDIf ALGO closes weekly above 0.30 and manages to hold this levels , we can see a huge rally towards the next resistance area which is 0.80. Make sure to have proper alerts as this can happen fast.

Buy $ALGOBuying EURONEXT:ALGO has peaked through Macro resistance for the first time in a long time, and it is an awesome blockchain!

Risk vs Rewardtaking into account it could be a broadening wedge. this position look like a very good Risk vs Reward kind of play.
Next immediate target could be around the 0.42 region

Super Bullish - This chart is just near breakout outAlgorand - I just bought this crypto ... buy and hold for 1 year enjoy the brekaout !!

ALGO - Shakeout / Accumulation / Bull MarketALGO looks like a tight accumulation here and it may have a big pop to join that party with other ISO20022 coins XLM XRP XDC.
Liquidity SRP Shakeout Reversal Pattern at ATL All Time Low complete and now it would appear it is ready to move on up.
ALGO is a big deal ISO20022 coin and this is probably the exact bottom of a major bull market.
I mostly give these calls to my clients first but this one I give to TradingView in prime position.
More calls like this in the pipeline.
This should be an ideal entry; right here 👍.
Not advice.

Watching $ALGO chart the next few weeksI'll be watching Algorand over the next few weeks on the weekly chart. A weekly close above .30 would signal a .65 target.
Go Algorand!

Inverse head and shoulders and golden cross on algorandMuch like litecoin’s current setup, algorand is also in the midst of completing the right shoulder of its inverse head and shoulders pattern as a golden cross is set to occur in the next 2 -4 daily candles. Hopefully the golden cross on both algorand and litecoin provide the same bullish momentum we’ve seen it already provide xlm, solana, and the total chart, if so we should see the price action break above the enckline of this inverse head ad shoulders pattern not long after. I’ll link the litecoin chart down below for easy access to compare the similarities between these two charts. *not financial advice*
