Alice in WONDERLANDA clear Divergence can be seen between price and CCI indicators. After breaking out from the descending trend line a major upward movement is expected.
ALICEUSDT trade ideas

ALICEUSDT 4H TFALICEUSDT is creating a HEAD AND SHOULDER PATTERN on 4h timeframe.
IF the price is going to continue rally down and retest, we can set a nice order

Alice condition!!!After heavy fall of market, unfortunately we lost our strong support but we located on another strong support (blue line)...we must wait for breaking major resistance..

ALICE gearing up for a runSummary:
1. The first target is the center median line.
2. The 2nd target is the upper median line giving ALICE 4x potential.
Chart: Daily w/ Log Scale

ALICE Long @ $18adx + sqz momentum, direccionalidad bajista sin fuerza, tendencia fuertemente alcista + antigua zona de soporte


ALICEUSDT is retestingHello traders.
after breaking the down trend line(marked in black) now price is retesting it. here is a strong support zone and we can expect for rejection.

ALICE in wonderlandALICE is in a good up trend channel , we have to be care full about the support area , so we have two plan to setup
first : buying half at first support area which is around 17 $
second : buying another half at the bottom of channel
" One hand cannot clap , work with each other "

Will ALICEUSDT recover to previous all time highs?My Neighbor Alice is a new multiplayer builder game that is centered around the world of Alice and features a complex of islands on which anybody can buy and develop plots of land by filling it with creations. This time the chart looks a little bit more complicated and noisy. I used the Action, Reaction method to find important trendlines. The token turmoiled from the price of $59 to $20 on the first day of trading, and then it continued on a downtrend to reach a low of $3.3. After reaching $3.3 the price reversed and started recovering. After drawing the Fibonacci levels from the high to the low I found that the price stopped from recovering and got rejected from the golden ratio of the downtrend, Which sits at the price of $23. So far Alice looks promising, because after the rejection Alice was able to make a higher low at the median line of the pitchfork and form a structure. At the time of writing, the price is struggling to break the resistance of $16.6 and is consolidating below it. Also bitcoin's selling pressure didn't stop. Alice can continue upwards from the level we are at and can reach a maximum of $44.9. Fundamentally, Alice has a partnership with the Sandbox, they will be adding an Alice "Neighborhood" feel to the metaverse by releasing characters that can be played across The Sandbox universe, Which is big for Alice considering how fast the metaverse is being adopted.
Personally I bought a good amount of ALICEUSDT in spot with no leverage. Gonna start selling and taking profits at the following levels. ($20 - $23 - $30 - $37.5 - $44.4)

alice break out and retestalice bullish breakout and retest done. well see these target in mid term. metaverse project coin

ALICEUSDT UPDATESince breaking out of this huge accumulation range a move we capitalised on, i made a call to close half of our position to secure profits to buy back in during a correction and thats exactly what the market has now provided us with.
If you missed the first impulsive move dont miss the second. Price is testing the previous resistance as new support in confluence with the 0.618, SEND IT

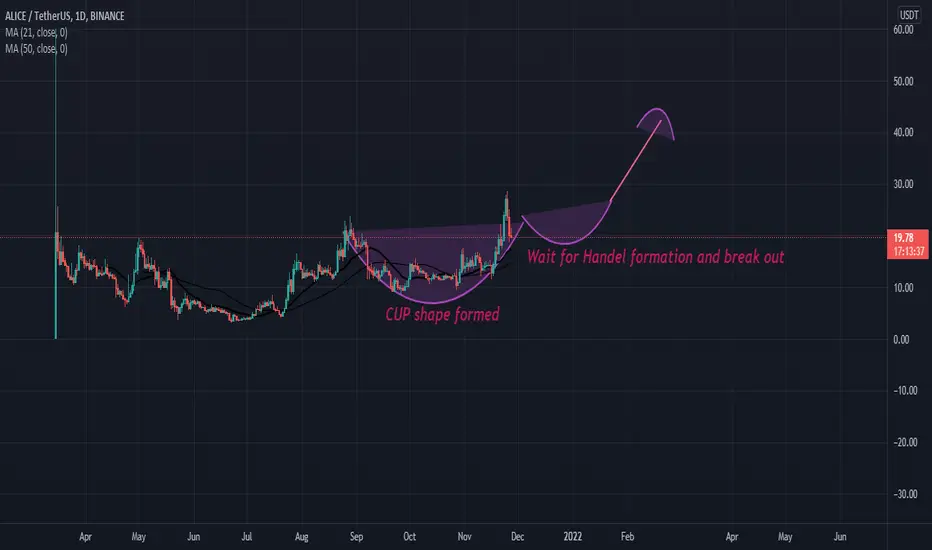
Alice is Forming cup and handel formationAlice is Forming a cup and handle formation, which is a sign of bullish. Use stop-loss always waits for confirmation before jumping into the market.
Thanks and happy trading.

Precarious Price Action on Alice, be cautious!
- On monthly, Alice has failed to break out of the descending channel.
- Flip of previous resistance to a demand zone is healthy to break out and confirm Cup and Handle.
- Green trendline might reject the breakout again as it has done previously with the Inverse HNS completion. Good 75% TP zone.
- Upon completion - Final TP is still at $44.5. Monitor BTC.D.
- BTC.D is on the verge of breaking out and money might flow back to BTC from Alts.

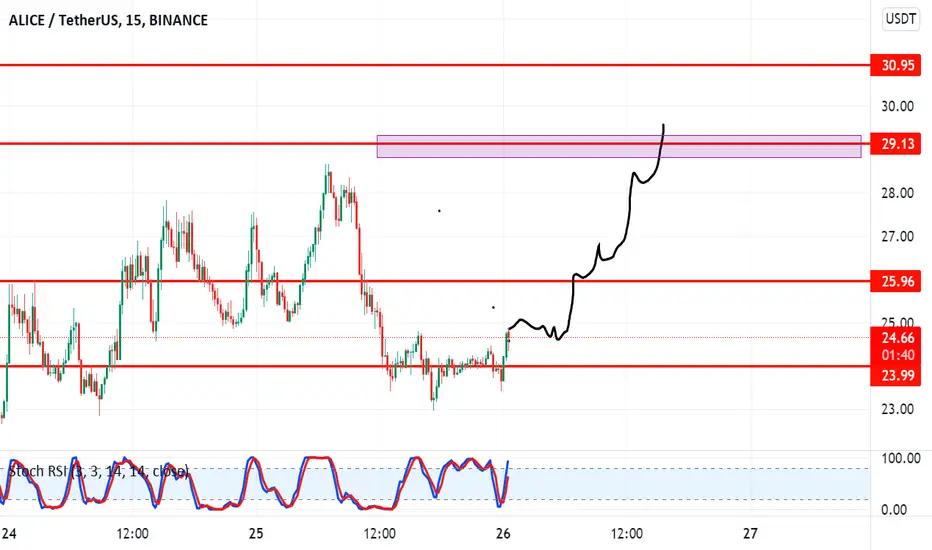
ALICE - Possible Entry on Range break Momentum is in a pull back with many of the Gaming and meta tokens, though I am willing to take an entry right here on ALICE as a possible retest of the recent range break. LTF minor declining resistance break out is currently being retested, very local action but may be the start of a large movement. Rising wedge trend acting as support, as is the range breakout levels. Scalping my way into this position and building it as I go.
Just bought in at 22.70
Will stop out below 22.50 on this entry
but ALICE will remain bullish for me above 20-21 range
Keeping risk low as I am trading against short term momentum
1H RSI looks nasty stuck under 50 but is at lower trend so may find a reversal here
Daily RSI was looking over bought but this pullback has given it a little headroom
Bearish tops on the recent 1H MACD which led to this pull back, but hidden bullish div on bottoms currently being printed
Could be setting up for a significant move if range break holds

Alice condition!!!Alice after touching our first target,now has reached to the last major support,We expect Alice to be able to maintain this area of support unless something special happens

Alice can give you an Unbelievable Profit!At first, in short term it is bearish and you can put your buy order at 20.7
Then, in mid term it is most probabely bullish
I strongly recommend you to even keep this token till Jan/Feb as it has 3 events on 31 Dec and 4 events on 31 Jan
but make it risk free
Please, buy Alice token for only 5-10% of your fund that you want to invest in crypto
Alice:
Start small, then grow your farmland into a booming business on blockchain. My Neighbor Alice is a multiplayer builder game, introducing blockchain to millions of players. Anyone can buy and own virtual islands, collect and build exciting items and meet new friends.

Alice has touched our first target!!From our calling for buying alice until now we has taken 23% profit in just two days, it's amazing 💪💪,now alice has came back to the major support and it is reloading for next target (34)...Targets will be updated according to status.

BULLISH MOMENTUM ON ALICE/USDTMy set up for ALICE as bullish signals signifies incoming breakout.
Trade with caution and see you at the top


ALICEAlice is at the first of third Eliot wave , I longed today and I will risk free when price hit to 15$ , and maybe close at 16$/17$ , it is safe I think , good luck
