ALPHA/USDT- 'V' Recovery ALPHA is in the process of forming a V-shape recovery, showing strong momentum to reclaim the 0.025 price zone. Yesterday’s daily candle printed a solid bullish reaction, indicating buyer strength stepping in
Stop Loss: Below 0.0084 (depending on risk appetite)
Related pairs

#ALPHA /USDT breakdown alert#ALPHA
The price is moving within a descending channel on the 1-hour frame and is expected to break and continue upward.
We have a trend to stabilize above the 100 moving average once again.
We have a downtrend on the RSI indicator that supports the upward break.
We have a support area at the lo

potential to buyOn many coins that have hit the previous weeks low 3 times in a row, and In all those coins, 5 of them have made another 3 days of breakout to the low of the week, looking to buy when a there is a session turnover to the upside. The second trade to finish the week. Hopefully tomorrow will be give a

ALPHAUSDT breakdown alertALPHAUSDT breakdown alert
ALPHAUSDT has broken down from a descending triangle pattern, which is typically a bearish continuation setup. The price failed to hold above the lower support trendline, indicating increased selling pressure and a possible continuation of the downtrend.
If the breakdown

ALPHA – Descending Channel Breakdown & Key Support Watch⚠️ NSE:ALPHA is slipping below its daily descending channel 📉.
🔍 Weekly chart highlights horizontal support nearby — crucial zone to monitor for either a bounce or deeper weakness.
👁 Stay sharp — market moves are heating up!

ALPHAUSDT 1D Analyss ALPHA ~ 1D Analysis
#ALPHA Buy after successfully breaking through this resistance line with a short-term target of at least 15%++.

ALPHAUSDT | Sellers in Control—Key Resistance Levels DefinedALPHAUSDT shows a brief uptick, but the underlying strength remains with sellers. Buyers have yet to demonstrate sustained conviction, and this suggests any rally may be engineered rather than genuine.
🔴 Manipulation Target: Red Line
A slight advance today appears aimed at the area marked by the re

Stella (Alpha) Starts to Recover From True-BottomLet's start with the linear chart.
ALPHAUSDT is trading at bottom prices and here we can appreciate two sessions recently with really high volume. When the bottom is getting close, we tend to see whale accumulation happening.
The second high volume session came in 28-April.
The session that produ

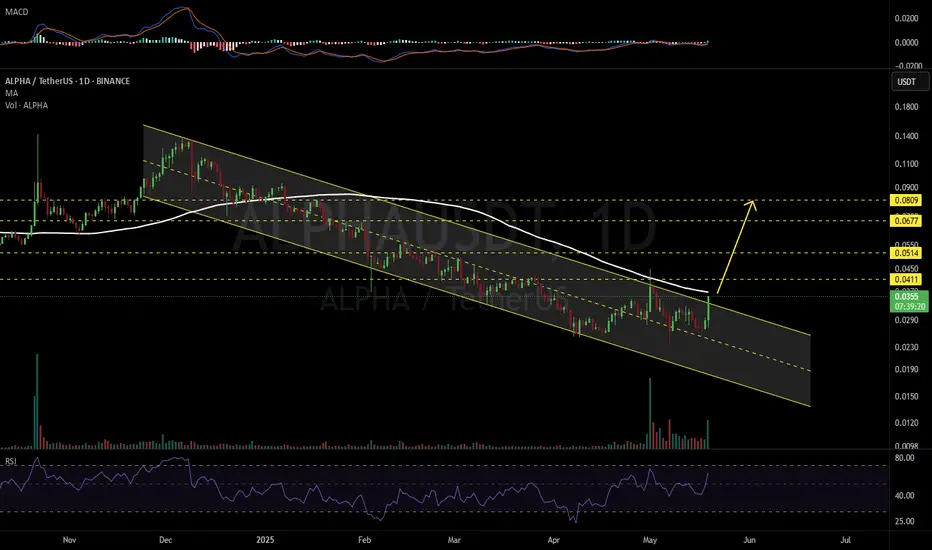
ALPHAUSDT 1D#ALPHA is breaking out above the descending channel on the daily chart. A successful retest of the channel and a breakout above the daily MA100 could trigger a 2x bullish rally. In that case, the targets are:
🎯 $0.0411
🎯 $0.0514
🎯 $0.0677
🎯 $0.0809
⚠️ Use a tight stop-loss.
ALPHA/USDT – Falling Wedge Breakout | Bullish Reversal in Play BINANCE:ALPHAUSDT has been trading within a classic falling wedge, a bullish reversal pattern, for several months. The wedge has been clearly defined by a series of lower highs and lower lows, gradually tightening into a breakout point.
The wedge’s measured move projects a potential 139% upside,

See all ideas
Summarizing what the indicators are suggesting.
Oscillators
Neutral
SellBuy
Strong sellStrong buy
Strong sellSellNeutralBuyStrong buy
Oscillators
Neutral
SellBuy
Strong sellStrong buy
Strong sellSellNeutralBuyStrong buy
Summary
Neutral
SellBuy
Strong sellStrong buy
Strong sellSellNeutralBuyStrong buy
Summary
Neutral
SellBuy
Strong sellStrong buy
Strong sellSellNeutralBuyStrong buy
Summary
Neutral
SellBuy
Strong sellStrong buy
Strong sellSellNeutralBuyStrong buy
Moving Averages
Neutral
SellBuy
Strong sellStrong buy
Strong sellSellNeutralBuyStrong buy
Moving Averages
Neutral
SellBuy
Strong sellStrong buy
Strong sellSellNeutralBuyStrong buy
Displays a symbol's price movements over previous years to identify recurring trends.
Frequently Asked Questions
The current price of Stella / Tether (ALPHA) is 0.01187 USDT — it has risen 8.06% in the past 24 hours. Try placing this info into the context by checking out what coins are also gaining and losing at the moment and seeing ALPHA price chart.
Stella / Tether price has fallen by −11.53% over the last week, its month performance shows a −47.31% decrease, and as for the last year, Stella / Tether has decreased by −82.06%. See more dynamics on ALPHA price chart.
Keep track of coins' changes with our Crypto Coins Heatmap.
Keep track of coins' changes with our Crypto Coins Heatmap.
Stella / Tether (ALPHA) reached its highest price on Nov 10, 2021 — it amounted to 1.34010 USDT. Find more insights on the ALPHA price chart.
See the list of crypto gainers and choose what best fits your strategy.
See the list of crypto gainers and choose what best fits your strategy.
Stella / Tether (ALPHA) reached the lowest price of 0.01130 USDT on Jul 2, 2025. View more Stella / Tether dynamics on the price chart.
See the list of crypto losers to find unexpected opportunities.
See the list of crypto losers to find unexpected opportunities.
The safest choice when buying ALPHA is to go to a well-known crypto exchange. Some of the popular names are Binance, Coinbase, Kraken. But you'll have to find a reliable broker and create an account first. You can trade ALPHA right from TradingView charts — just choose a broker and connect to your account.
Crypto markets are famous for their volatility, so one should study all the available stats before adding crypto assets to their portfolio. Very often it's technical analysis that comes in handy. We prepared technical ratings for Stella / Tether (ALPHA): today its technical analysis shows the sell signal, and according to the 1 week rating ALPHA shows the sell signal. And you'd better dig deeper and study 1 month rating too — it's sell. Find inspiration in Stella / Tether trading ideas and keep track of what's moving crypto markets with our crypto news feed.
Stella / Tether (ALPHA) is just as reliable as any other crypto asset — this corner of the world market is highly volatile. Today, for instance, Stella / Tether is estimated as 12.77% volatile. The only thing it means is that you must prepare and examine all available information before making a decision. And if you're not sure about Stella / Tether, you can find more inspiration in our curated watchlists.
You can discuss Stella / Tether (ALPHA) with other users in our public chats, Minds or in the comments to Ideas.