ALPHA/USDT- 'V' Recovery ALPHA is in the process of forming a V-shape recovery, showing strong momentum to reclaim the 0.025 price zone. Yesterday’s daily candle printed a solid bullish reaction, indicating buyer strength stepping in
Stop Loss: Below 0.0084 (depending on risk appetite)
ALPHAUSDT trade ideas

#ALPHA /USDT breakdown alert#ALPHA
The price is moving within a descending channel on the 1-hour frame and is expected to break and continue upward.
We have a trend to stabilize above the 100 moving average once again.
We have a downtrend on the RSI indicator that supports the upward break.
We have a support area at the lower limit of the channel at 0.01111, acting as strong support from which the price can rebound.
Entry price: 0.01156.
First target: 0.01288.
Second target: 0.01400.
Third target: 0.01512.
To manage risk, don't forget stop loss and capital management.
When you reach the first target, save some profits and then change the stop order to an entry order.
For inquiries, please comment.
Thank you.

ALPHA/USDTKey Level Zone: 0.01150 - 0.01200
LMT v2.0 detected.
The setup looks promising—price previously trended upward with rising volume and momentum, then retested this zone cleanly. This presents an excellent reward-to-risk opportunity if momentum continues to align.
Introducing LMT (Levels & Momentum Trading)
- Over the past 3 years, I’ve refined my approach to focus more sharply on the single most important element in any trade: the KEY LEVEL.
- While HMT (High Momentum Trading) served me well—combining trend, momentum, volume, and structure across multiple timeframes—I realized that consistently identifying and respecting these critical price zones is what truly separates good trades from great ones.
- That insight led to the evolution of HMT into LMT – Levels & Momentum Trading.
Why the Change? (From HMT to LMT)
Switching from High Momentum Trading (HMT) to Levels & Momentum Trading (LMT) improves precision, risk control, and confidence by:
- Clearer Entries & Stops: Defined key levels make it easier to plan entries, stop-losses, and position sizing—no more guesswork.
- Better Signal Quality: Momentum is now always checked against a support or resistance zone—if it aligns, it's a stronger setup.
- Improved Reward-to-Risk: All trades are anchored to key levels, making it easier to calculate and manage risk effectively.
- Stronger Confidence: With clear invalidation points beyond key levels, it's easier to trust the plan and stay disciplined—even in tough markets.
Whenever I share a signal, it’s because:
- A high‐probability key level has been identified on a higher timeframe.
- Lower‐timeframe momentum, market structure and volume suggest continuation or reversal is imminent.
- The reward‐to‐risk (based on that key level) meets my criteria for a disciplined entry.
***Please note that conducting a comprehensive analysis on a single timeframe chart can be quite challenging and sometimes confusing. I appreciate your understanding of the effort involved.
Important Note: The Role of Key Levels
- Holding a key level zone: If price respects the key level zone, momentum often carries the trend in the expected direction. That’s when we look to enter, with stop-loss placed just beyond the zone with some buffer.
- Breaking a key level zone: A definitive break signals a potential stop‐out for trend traders. For reversal traders, it’s a cue to consider switching direction—price often retests broken zones as new support or resistance.
My Trading Rules (Unchanged)
Risk Management
- Maximum risk per trade: 2.5%
- Leverage: 5x
Exit Strategy / Profit Taking
- Sell at least 70% on the 3rd wave up (LTF Wave 5).
- Typically sell 50% during a high‐volume spike.
- Move stop‐loss to breakeven once the trade achieves a 1.5:1 R:R.
- Exit at breakeven if momentum fades or divergence appears.
The market is highly dynamic and constantly changing. LMT signals and target profit (TP) levels are based on the current price and movement, but market conditions can shift instantly, so it is crucial to remain adaptable and follow the market's movement.
If you find this signal/analysis meaningful, kindly like and share it.
Thank you for your support~
Sharing this with love!
From HMT to LMT: A Brief Version History
HM Signal :
Date: 17/08/2023
- Early concept identifying high momentum pullbacks within strong uptrends
- Triggered after a prior wave up with rising volume and momentum
- Focused on healthy retracements into support for optimal reward-to-risk setups
HMT v1.0:
Date: 18/10/2024
- Initial release of the High Momentum Trading framework
- Combined multi-timeframe trend, volume, and momentum analysis.
- Focused on identifying strong trending moves high momentum
HMT v2.0:
Date: 17/12/2024
- Major update to the Momentum indicator
- Reduced false signals from inaccurate momentum detection
- New screener with improved accuracy and fewer signals
HMT v3.0:
Date: 23/12/2024
- Added liquidity factor to enhance trend continuation
- Improved potential for momentum-based plays
- Increased winning probability by reducing entries during peaks
HMT v3.1:
Date: 31/12/2024
- Enhanced entry confirmation for improved reward-to-risk ratios
HMT v4.0:
Date: 05/01/2025
- Incorporated buying and selling pressure in lower timeframes to enhance the probability of trending moves while optimizing entry timing and scaling
HMT v4.1:
Date: 06/01/2025
- Enhanced take-profit (TP) target by incorporating market structure analysis
HMT v5 :
Date: 23/01/2025
- Refined wave analysis for trending conditions
- Incorporated lower timeframe (LTF) momentum to strengthen trend reliability
- Re-aligned and re-balanced entry conditions for improved accuracy
HMT v6 :
Date : 15/02/2025
- Integrated strong accumulation activity into in-depth wave analysis
HMT v7 :
Date : 20/03/2025
- Refined wave analysis along with accumulation and market sentiment
HMT v8 :
Date : 16/04/2025
- Fully restructured strategy logic
HMT v8.1 :
Date : 18/04/2025
- Refined Take Profit (TP) logic to be more conservative for improved win consistency
LMT v1.0 :
Date : 06/06/2025
- Rebranded to emphasize key levels + momentum as the core framework
LMT v2.0
Date: 11/06/2025

potential to buyOn many coins that have hit the previous weeks low 3 times in a row, and In all those coins, 5 of them have made another 3 days of breakout to the low of the week, looking to buy when a there is a session turnover to the upside. The second trade to finish the week. Hopefully tomorrow will be give a trade entry

ALPHAUSDT breakdown alertALPHAUSDT breakdown alert
ALPHAUSDT has broken down from a descending triangle pattern, which is typically a bearish continuation setup. The price failed to hold above the lower support trendline, indicating increased selling pressure and a possible continuation of the downtrend.
If the breakdown sustains with strong volume, we may see further downside movement. However, if the price quickly reclaims the broken support level, the move could turn out to be a fakeout.
Key levels to watch:
* Previous support now acting as resistance
* Breakdown confirmation zone
* Volume strength for validation
Keep an eye on ALPHA — confirmation of this breakdown could lead to lower targets ahead.

ALPHA – Descending Channel Breakdown & Key Support Watch⚠️ NSE:ALPHA is slipping below its daily descending channel 📉.
🔍 Weekly chart highlights horizontal support nearby — crucial zone to monitor for either a bounce or deeper weakness.
👁 Stay sharp — market moves are heating up!

ALPHAUSDT 1D Analyss ALPHA ~ 1D Analysis
#ALPHA Buy after successfully breaking through this resistance line with a short-term target of at least 15%++.

ALPHAUSDT | Sellers in Control—Key Resistance Levels DefinedALPHAUSDT shows a brief uptick, but the underlying strength remains with sellers. Buyers have yet to demonstrate sustained conviction, and this suggests any rally may be engineered rather than genuine.
🔴 Manipulation Target: Red Line
A slight advance today appears aimed at the area marked by the red line, where liquidity may be swept before a reversal. This level serves as a likely pivot for engineered moves designed to trap uninformed participants.
🔴 Core Resistance: Red Box
Beyond the red line, the red box identifies the primary seller domain. Price has stalled here repeatedly, confirming that sellers guard this zone aggressively. Until ALPHAUSDT clears the red box on substantial volume and with clear low‑time‑frame breakouts, the bearish bias remains intact.
📉 How to Trade This Setup
Short Entries
• Look for price to approach the red line and fail to hold—this often precedes a stronger reversal into the red box.
• Confirm with a clean breakdown on lower time frames and a negative divergence in CDV to validate seller dominance.
Risk Management
• Place stops just above the red box or red line, depending on your preferred trigger, to cap potential losses.
Stay Patient
• If price unexpectedly breaks above these levels with convincing volume and retests as support, only then will I reconsider the bearish view.
By focusing on where genuine selling pressure resides, and waiting for real confirmations, you avoid getting caught in manipulative spikes and trade with confidence.
📌I keep my charts clean and simple because I believe clarity leads to better decisions.
📌My approach is built on years of experience and a solid track record. I don’t claim to know it all but I’m confident in my ability to spot high-probability setups.
📌If you would like to learn how to use the heatmap, cumulative volume delta and volume footprint techniques that I use below to determine very accurate demand regions, you can send me a private message. I help anyone who wants it completely free of charge.
🔑I have a long list of my proven technique below:
🎯 ZENUSDT.P: Patience & Profitability | %230 Reaction from the Sniper Entry
🐶 DOGEUSDT.P: Next Move
🎨 RENDERUSDT.P: Opportunity of the Month
💎 ETHUSDT.P: Where to Retrace
🟢 BNBUSDT.P: Potential Surge
📊 BTC Dominance: Reaction Zone
🌊 WAVESUSDT.P: Demand Zone Potential
🟣 UNIUSDT.P: Long-Term Trade
🔵 XRPUSDT.P: Entry Zones
🔗 LINKUSDT.P: Follow The River
📈 BTCUSDT.P: Two Key Demand Zones
🟩 POLUSDT: Bullish Momentum
🌟 PENDLEUSDT.P: Where Opportunity Meets Precision
🔥 BTCUSDT.P: Liquidation of Highly Leveraged Longs
🌊 SOLUSDT.P: SOL's Dip - Your Opportunity
🐸 1000PEPEUSDT.P: Prime Bounce Zone Unlocked
🚀 ETHUSDT.P: Set to Explode - Don't Miss This Game Changer
🤖 IQUSDT: Smart Plan
⚡️ PONDUSDT: A Trade Not Taken Is Better Than a Losing One
💼 STMXUSDT: 2 Buying Areas
🐢 TURBOUSDT: Buy Zones and Buyer Presence
🌍 ICPUSDT.P: Massive Upside Potential | Check the Trade Update For Seeing Results
🟠 IDEXUSDT: Spot Buy Area | %26 Profit if You Trade with MSB
📌 USUALUSDT: Buyers Are Active + %70 Profit in Total
🌟 FORTHUSDT: Sniper Entry +%26 Reaction
🐳 QKCUSDT: Sniper Entry +%57 Reaction
📊 BTC.D: Retest of Key Area Highly Likely
📊 XNOUSDT %80 Reaction with a Simple Blue Box!
📊 BELUSDT Amazing %120 Reaction!
📊 Simple Red Box, Extraordinary Results
I stopped adding to the list because it's kinda tiring to add 5-10 charts in every move but you can check my profile and see that it goes on..

Stella (Alpha) Starts to Recover From True-BottomLet's start with the linear chart.
ALPHAUSDT is trading at bottom prices and here we can appreciate two sessions recently with really high volume. When the bottom is getting close, we tend to see whale accumulation happening.
The second high volume session came in 28-April.
The session that produced the correction bottom was the week of 5-May. Now ALPHAUSDT is turning green.
The orthodox end of the bear market happened June 2022 and the ensuing action is the same consolidation pattern we've been seeing through many charts. The difference is that here we have lower lows. Some produce higher lows others lower lows, still, it is the same market phase. A transition period from neutral to bullish. Look at the linear chart again and you can see the action being 100% flat.
Now, once we hit bottom, there is no other place left to go but up.
» ALPHAUSDT already hit bottom just two weeks ago; it is getting ready to grow. Long-term growth. This is an easy buy and hold.
Namaste.

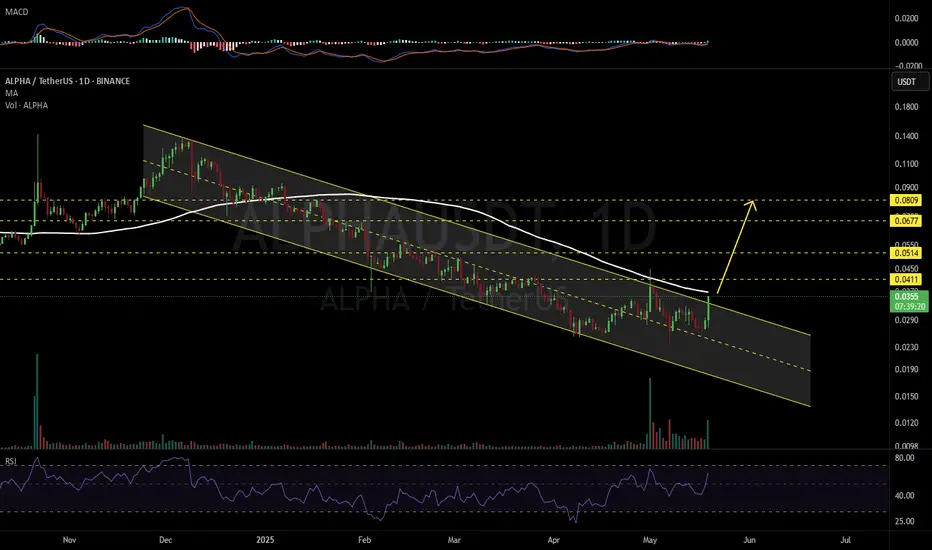
ALPHAUSDT 1D#ALPHA is breaking out above the descending channel on the daily chart. A successful retest of the channel and a breakout above the daily MA100 could trigger a 2x bullish rally. In that case, the targets are:
🎯 $0.0411
🎯 $0.0514
🎯 $0.0677
🎯 $0.0809
⚠️ Use a tight stop-loss.
ALPHA/USDT – Falling Wedge Breakout | Bullish Reversal in Play BINANCE:ALPHAUSDT has been trading within a classic falling wedge, a bullish reversal pattern, for several months. The wedge has been clearly defined by a series of lower highs and lower lows, gradually tightening into a breakout point.
The wedge’s measured move projects a potential 139% upside, aligning with key horizontal resistance levels and previous supply zones. A sustained rally could target the 0.05–0.067 zone in the medium term.
Key Levels to watch
Entry: ~0.02885 - 0.02650 (post-retest confirmation)
Target 1: 0.03801
Target 2: 0.05225
Final Target: 0.06731
Stop Loss: ~0.02254 (below wedge and key demand zone)
Consider trailing stops as price approaches key resistances.
Keep an eye on broader market sentiment — BTC/ETH retracements may affect follow-through.


ALPHA Structure Analysis - 50-day EMA breakoutYesterday, BINANCE:ALPHAUSDT cleanly broke and closed above the 50-day EMA, which it hadn't been able to reclaim since December 2024. It also retested the previous $0.042-$0.052 demand zone, which acted as resistance.
Check the weekly chart below for more context:
Key Levels
• $0.024-$0.034: Main demand zone, dating back to October 2020
• $0.042-$0.052: Previous demand zone and current resistance
• ~$0.070: Previous key S/R, currently reinforced by 1-year EMA, and potential resistance
• $0.115-$0.137: Main supply zone
Trigger
I am looking for a retest of the 50-day EMA (~0.035) as support for a long entry, with a clear invalidation below the recent $0.025 swing low, targeting the main supply zone with the other key levels outlined above as partial TP targets.

ALPHA is Ready To Fly (8H)ALPHA has encountered a key zone filled with strong buy orders.
The volume of these orders appears sufficient to potentially pump ALPHA to higher levels.
On the chart, we also have bullish confirmations, such as the formation of a CH (Change of Character) and the breakout of the trigger line.
As long as the green zone holds, ALPHA can move toward the target profit (TP) levels marked on the chart.
However, a daily candle closing below the invalidation level would invalidate this analysis.
Do not enter the position without capital management and stop setting
Comment if you have any questions
thank you

ALPHA Potential ReversalPrice rise was strongly rejected at the August 2024 low, which is now a key level.
Nevertheless, I am currently biased to the upside, with a presence of bullish RSI divergence in the daily chart.
In this scenario, the recent rise would be a leading diagonal (green 1-5).
The gray zone shown in the chart could offer the support needed for a new uptrend leg.

#ALPHA/USDT#ALPHA
The price is moving within a descending channel on the 1-hour frame, adhering well to it, and is heading for a strong breakout and retest.
We are seeing a bounce from the lower boundary of the descending channel, which is support at 0.0293.
We have a downtrend on the RSI indicator that is about to be broken and retested, supporting the upward trend.
We are looking for stability above the 100 moving average.
Entry price: 0.0300
First target: 0.0306
Second target: 0.0314
Third target: 0.0323

ALPHA Is Ready To Fly (8H)ALPHA has encountered a key zone filled with strong buy orders.
The volume of these orders appears sufficient to potentially pump ALPHA to higher levels.
On the chart, we also have bullish confirmations, such as the formation of a CH (Change of Character) and the breakout of the trigger line.
As long as the green zone holds, ALPHA can move toward the target profit (TP) levels marked on the chart.
However, a daily candle closing below the invalidation level would invalidate this analysis.
Do not enter the position without capital management and stop setting
Comment if you have any questions
thank you

ALPHAUSDT UPDATEALPHA Technical Setup
Pattern: Falling Wedge Breakout
Current Price: $0.0292
Target Price: $0.0667
Target % Gain: 145.78%
Technical Analysis: ALPHA has broken out of a falling wedge pattern on the 1D timeframe with a bullish candle and slight volume increase. Breakout looks valid with potential for strong upside momentum.
Time Frame: 1D
Risk Management Tip: Always use proper risk management.

ALPHAUSDT Downtrend Opportunity and Target ZoneALPHAUSDT has broken a key support level, signaling a potential strong downtrend. The focus is now on a possible pullback to the designated sell-off area, which presents an opportunity to enter short positions.
The primary target for this downtrend is the external demand zone marked on the chart. This zone is expected to act as the final destination for the current bearish movement, where significant buying pressure may emerge.
We should watch for the pullback to the sell-off area for optimal short entry, while keeping the external demand zone in sight as the ultimate price target.

ALPHAUSDT 1WALPHA ~ 1W Analysis
#ALPHA This is the lowest support for now. Buy from here with a short -term target of at least 15%+. Trading is very high risk.

ALPHA - Beautiful Prediction SignalThose Levels played out beautifully.
I expected 2 % but look what happened. I changed my bias as market changed its sentiment.
💵💲 3x 7,5 %
That green level for long was front ran 2 times.
Retracement to Golden Pocket of the Fib and then BOOOOM ...🎯 👌
Here the original Signal/TA :https://www.tradingview.com/chart/ALPHAUSDT.P/RXYV0paK-ALPHA-Some-New-Levels/
Follow for more ideas/Signals. 💲
Look at my other ideas 😉
Just donate some of your profit to Animal rights and rescue or other charity :)✌️

ALPHA - Nice Signal/TA.Those Levels played out beautifully.
i expected 2 %
7,5 % 🎯 👌
after that clear rejection, should let it run ....
Retracement to Golden Pocket and then BOOOOM ...🎯 👌
Here the original Signal/TA :
Follow for more ideas/Signals. 💲
Look at my other ideas 😉
Just donate some of your profit to Animal rights and rescue or other charity :)✌️

ALPHA - Some New Levels There are some new levels which can give about 2% pure profit for a Short and Long.
🔴 Red Mark: expect a 2% short on it. A retest of lower yellow horizontal line on OBV could be a reference for red marked void line on price chart.
🟢 Green Mark: Here we could see a Swing Failure Pattern (SFP) which can be traded for 2% TP.
- The price drop was way too harsh and this could lead to a strong pullback, hence the 2% limit for TPs.
- FVG could has correlation to upper yellow horizontal line on OBV.
Look at my previous ALPHA Signal/TA which was really nice:https://www.tradingview.com/chart/ALPHAUSDT.P/MqsOEUcr-ALPHA-Coming-Short/
That void level gave us 2.6% Long 🎯 👌
Follow for more ideas/Signals. 💲
Look at my other ideas 😉
Just donate some of your profit to Animal rights and rescue or other charity :)✌️
