Alpha/usdt approaching a critical breakout zone Alpha/usdt approaching a critical breakout zone
Alpha/usdt is nearing a significant trendline resistance after a prolonged consolidation phase. The price action suggests that momentum is building for a potential breakout. If this happens, it could pave the way for a strong bullish move.
Key observations:
- The trendline has acted as a cap on the price for an extended period, and a break above it could indicate a major shift in market dynamics.
- Volume is gradually increasing, signaling growing interest among traders.
- Momentum indicators like rsi and macd are aligning with the potential breakout, hinting at a bullish bias.
Tips for trading this setup:
- Wait for a clear 4h or daily candle close above the trendline to confirm the breakout.
- Look for a retest of the breakout zone to establish it as a new support level.
- Ensure the breakout is supported by a noticeable increase in trading volume to validate its strength.
Risk management is key. Set a stop-loss below the breakout zone to manage potential invalidation and position yourself wisely. This analysis is for educational purposes; always do your own research and trade responsibly.
ALPHAUSDT trade ideas

ALPHA Will Shows Significant Gains But Finally CollapsesHello, Skyrexians!
As you know we like to share with you analysis on crypto assets which are in uptrend and have significant potential to grow. Today we wanna show you the example of coin which is likely in global downtrend. For sure BINANCE:ALPHAUSDT has not set the lower low in comparison to previous bull run, but it dropped significantly to set the new ATH, that is we expect only exit pump.
Let's take a look at the weekly time frame. We can see that current bear market is much more intensive than on other assets. We can see here the clear 5 Elliott waves structure to the downside. The wave 5 is likely to be finished already finishing the wave 1 of higher degree. Green dot on the Bullish/Bearish Reversal Bar Indicator shows us the strongest reversal sign that bear market is finished.
It means, that large wave 2 can happen now. Despite this asset is in global downtrend it can make significant gains reaching 0.5-0.61 Fibonacci retracement level. Notice that this Fibonacci based on regular chart. We show Fibo chart for your convenience. The target is located between $1.47 and $1.87. After such incredible growth we expect the huge crash to new all-time low.
Best regards,
Skyrexio Team
___________________________________________________________
Please, boost this article and subscribe our page if you like analysis!

ALPHAUSDT 1WALPHA ~ 1W
#ALPHA If you still have Conviction on this coin,. Buy gradually inside this pattern,. it is only a matter of time that this resistance line is successfully broken, with a minimum target of 20%+

Alpha/USDT - Trade Plan - 1 hrAlpha is currently in an uptrend on daily tf.
it has respected 4h demand zone and internal structure is shifted indicating continuation of the trend.
Trade plan:
Market Buy: 0.0811
Stoploss: 0.075
Units: 78884
Risk: 0.5%
This is my personal trade plan - NFA - DYOR

Alpha - Could the whales be accumulating?My friends,
I continue to search for another coin that has yet to show significant movement amidst a market filled with optimism for investors, especially with the explosive growth of XRP. I am looking for a coin tied to the decentralized finance (DeFi) sector. With these two criteria in mind, Alpha has caught my attention.
What drew me to this coin wasn’t a divergence between price and RSI indicating a reversal, but rather its trading volume at the end of October. Do you see the trading volume I highlighted? It stands out remarkably compared to previous periods.
Even more striking, while the volume surged significantly, the price remained relatively stable. I’ve observed this across different timeframes and asked myself questions. The most convincing one is this: could the whales be accumulating? I don’t know for sure!
But I think it’s time to place an order and patiently wait to see the price levels it can achieve.
Best Regards,

Alpha/USDT - trade plan - 15 min tftime frame - 15 mins,
continuation of bullish trend on daily time frame, internal structure shift.
tp - weak daily high

3 Altcoins to watch this weekend...BINANCE:RAREUSDT
After a 50% surge, RARE is currently in a sharp correction phase.
As it approaches the black structure, I will be looking for trend-following longs.
BINANCE:MASKUSDT
Just like RARE, MASK surged by over 60% forming a massive demand zone marked in blue.
As it retests the demand zone, it would be an attractive zone to look for longs at a discount.
BINANCE:ALPHAUSDT
This one is the strongest among today's list, as it surged by almost 50% 2 weeks ago.
ALPHA has been in a correction mode and seems the bears are loosing momentum.
The more it approaches the gray demand zone, the more potential the bulls will have to kick in.
Which altcoins would you like me to cover next?
All Strategies Are Good; If Managed Properly!
~Rich

Stella (ALPHA) - 5000% returnOn the above weekly chart price action has corrected 98% in a downtrending channel since February 2021. A number of reasons now exist to be long, including:
1) Price action and RSI resistance breakouts.
2) Price action exits a near 2 year consolidation.
3) Price action confirms a trend reversal with the first higher low higher high since 2020.
4) The downward channel or Bull flag confirms a breakout. The flagpole extension measures out at 8600%.
Is it possible price action corrects further? Sure.
It is probable? No.
Ww
Type: trade
Risk: <=6%
Timeframe to take a long position: This month
Return: 5000%

ALPHAUSDT.PHow are you on this beautiful Friday?
I’m watching the ALPHAUSDT pair on the daily chart, and it seems bearish. Here’s why:
First, there’s an inverse hammer candle that was stopped at the black line resistance.
Second, the price has fallen back below the 200MA after a failed crossover.
One thing I don’t like is the volume from October 22. However, when switching to the 4H candles, I can see that most of the volume was on the downside, which reinforces my bearish bias.
Thanks for reading!

ALPHA Short itIn the spirit of Decadura - Easiest short of my life.
Looking for a minimum 10% down move over the next few days.
0.14 should be perfect entry but im scaling in here.
Enter the bearus

Alpha Stella price was pumped strong, why?)#ALPHA price has gained +150% and was pumped in just 3 days. Previously, this happened with #APE
What's going on?) Apart from the rebranding to #Stella, does anyone else know anything?
Because now it remains to select coins that have been falling for a very long time, and now they have formed a pattern at the bottom, as shown on the chart, and hope that your coin will be the next to be pumped)
P.S:
OKX:ALPHAUSDT price has entered a zone of strong sales, so we would not be comfortable taking it long before $0.078-0.080
_____________________
Did you like our analysis? Leave a comment, like, and follow to get more

Alpha Finance Lab (1,200%+ Growth Potential)This is one that is still pretty early on. Notice the low that was hit in January 2023. Alpha Finance Lab (ALPHAUSDT) moves below this low producing a new ATL and then recovers. The recovery puts the chart in bullish territory.
Bullish territory means that we are ready to grow.
At the same time we have this rounded bottom and the blue lines would be the consolidation range.
Growth potential is huge for this and it can grow fast once it starts going, because the market is waking up with a bang.
➢ Buy and hold. Patience is key; the market takes care of the rest.
Thank you for your continued support.
Namaste.

Alikze »» ALPHA | Movement in the descending channel🔍 Technical analysis: Movement in the descending channel
- In the 1D and 1W time frames, it is moving in a descending channel.
- It has encountered support in the range of the green box.
- Due to the change in structure and behavior in the 1D time frame, it can have an upward movement up to the limit of the ceiling of the descending channel.
💎 If the current rising wave is accelerated, after hitting the first supply area which is the neck line of the previous corrective wave, it can continue the upward trend after a temporary correction to the next supply area.
⚠️ In addition, if the floor of the previous range is touched, the bullish scenario will be invalidated and must be reviewed and updated again.⚠️
»»»«««»»»«««»»»«««
Please support this idea with a LIKE and COMMENT if you find it useful and Click "Follow" on our profile if you'd like these trade ideas delivered straight to your email in the future.
Thanks for your continued support.
Best Regards,❤️
Alikze.
»»»«««»»»«««»»»«««
BINANCE:ALPHAUSDT

ALPHA Long Trade 1H Timeframe
I'm expecting another push to the upside after the bolue ABC correction.
My entry is the 50% pullback of the 1st leg up, at 0.0642, with 2 partial targets and the final target in the recent pivot high at 0.70.

ALPHA/USDT INCOMING 50% SHORT POSITIONCurrently in a long quick scalp position as you can see on the charts, after that I will shift to the short position where I am looking for 40-50% gains. This analysis is based on my gut feeling and a little bit of patterns and history (I am trading since 8 years having seen 3 bull runs, this is my fourth bull run).
Let's see how this one plays out.

ALPHAUSDT 1WALPHA ~ 1W
#ALPHA Make purchases gradually on this support block. with a target of at least 15%+ from here.

ALPHA Is going to bounceOn higher timeframe (weekly) ALPHA is still n the accumulation phase, and that's good for the long term investor. For long term, $0,28 is the first possible target. Looking at short term, I think we will see a bounce probably from the $.097/0.1 area, and we the price should go to close the fair value gap, and we can target 0.124 first and 0.129 next

Alpha in Wyckoff accumulation patternLooking at the 4h chart, it can be clearly seen that it is in an accumulation phase. We are currently after the 2nd ST and will test the UA zone at 0.1276. To do this, we need to look at the chart more closely.
On the 1h chart, we can see that after the 2nd ST, which went all the way below the grey support, a micro Wyckoff accumulation is also happening, which is supposed to create a stronger buying pressure. If the price successfully breaks above UA(2) and retest it, then we go to the aforementioned 4h UA zone. If it fails then we presumably test the grey support again.

ALPHA/USDT It required break the resistance for reversal to UP!💎 Paradisers, #ALPHA is indeed exhibiting promising movements that warrant close attention.
💎 Currently, it appears that the price is poised to undergo a retest of the support area around 0.115 before potentially bouncing back to face the resistance zone between 0.13 and 0.1415.
💎 Should ALPHA successfully break above this resistance, it could signify not only a breakout from the immediate resistance but also from the descending pattern.
💎 Such a breakout would likely indicate a shift towards bullish sentiment, potentially leading to significant upward movement towards our target strong resistance area.
💎 However, if ALPHA fails to bounce off the support level and instead breaks down below it, there's a possibility that the price may revisit the key support area.
💎 Given ALPHA's historical tendency to bounce off key support levels, revisiting this zone could serve as a potential reversal point, allowing ALPHA to once again attempt to break through the resistance.
💎 Nevertheless, it's crucial to monitor ALPHA's ability to sustain its price above the key support area. A breakdown below this level would validate bearish momentum, and the bullish thesis would be invalidated. In such a scenario, the price may experience further downward movement.
MyCryptoParadise
iFeel the success🌴

ALPHAUSDT longALPHA/USDT
Sector: DeFi / Lending Protocol
Market Cap: $90M
ALPHA is one of the crypto that hasn't explode yet to the upside, and is still in the bear market accumulation range. This range has started in May 2022, 2 years ago.
Now that we are in the lower half of this range, it might be a good idea to start buying if you think that the project is interesting and has solid fundamentals. Alternatively, you could try to enter with a Stop Loss when we reach the bottom of the range.
Another strategy would be to go long on the range break, but the risk will be higher. In short, this kind of pattern can offer great opportunities and can be traded in different ways depending on your strategy. Keep an eye on this chart and apply your trading plan!

ALPHA - Symmetrical TriangleAlpha is currently presenting an interesting trading proposition.
Reasons to consider an entry
- Currently showing a symmetrical triangle pattern on the 3 day chart.
- Trading on support: bottom of the triangle and in price action
- Golden ratio support
- Stoch RSI below the 20 showing an oversold position
Will be interesting to see how this one plays out.
Have a great day :)

ALPHAUSDTHello friends, today you can review the technical analysis idea on a 1D linear scale chart for ALPHAUSDT
target
0.24
stoploss
0.10
target 100%

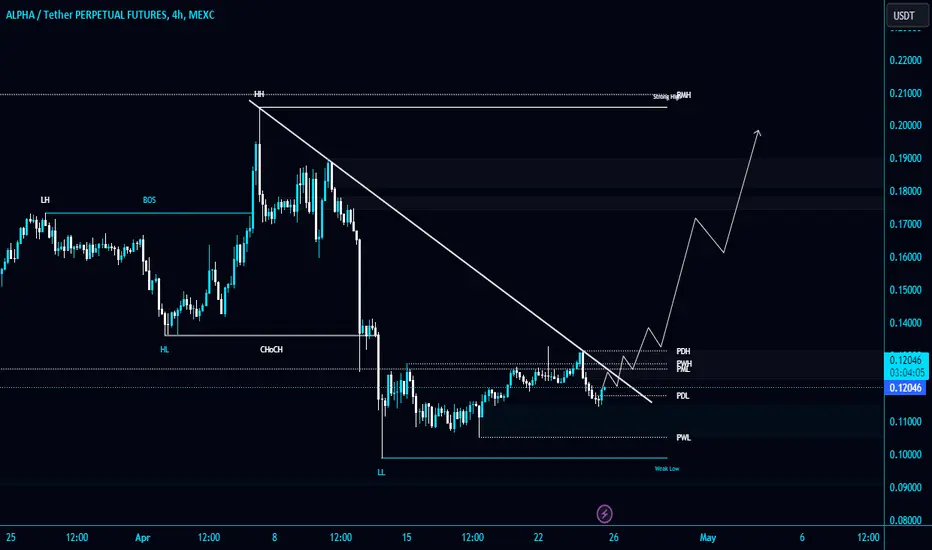
#ALPHA/USDT is respecting Trendline as a resistance in 4-Hour TF#ALPHA/USDT is respecting Trendline as a resistance in 4-Hour TF!
Keep an eye on it! #ALPHAUSDT needs to clear the PWH $0.128 and Diagonal Trendline to gain bullish momentum. The resistance level is PMH $0.2095.