ALPINE / USDT : looking bullish ALPINEUSDT Analysis:
The price is currently retesting the downward trendline. This is a crucial point where the price may either bounce off or fail to hold the trendline, signaling the next major move.
Bullish Scenario:
Trendline Retest and Bounce: If the price holds above the trendline and shows bullish momentum, we could see a rise towards 1.099 (125.45% potential upside).
Confirmation: Look for strong buying volume during the retest to confirm the bounce.
Bearish Scenario:
Trendline Breakdown: If the price fails to hold the trendline and breaks below it, this could trigger a downward move.
Target: Watch for the next support levels to gauge the potential downside.
ALPINEUSDT trade ideas
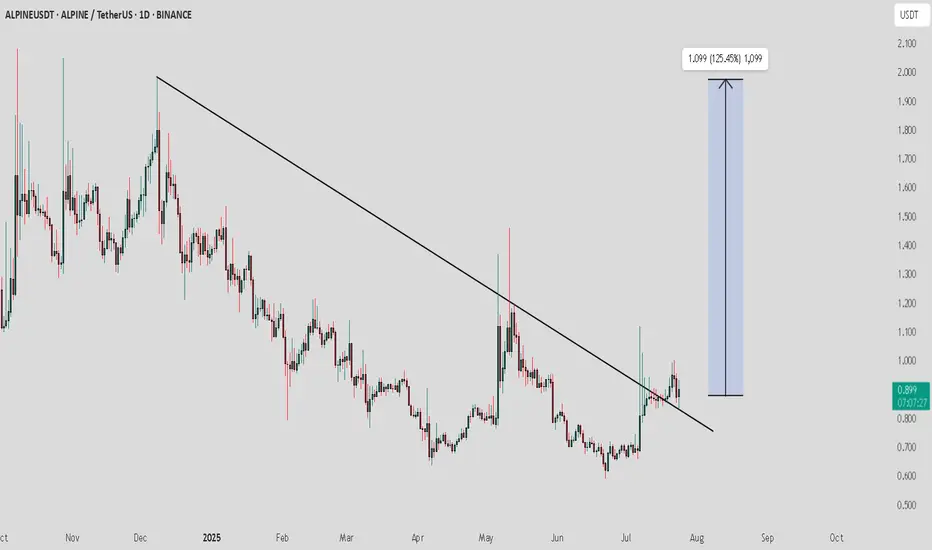
ALPINEUSDT 1D#ALPINE has formed a falling wedge pattern on the daily timeframe — a classic bullish reversal setup. After several months of consolidation and lower highs within the wedge, the price is now approaching the upper resistance trendline. A breakout above this resistance could spark a strong upward rally.
Currently, the RSI is near the overbought zone, suggesting some caution in the short term. However, the overall structure remains bullish, especially if the price can stay above key support levels.
The best buying opportunities lie near the key horizontal support levels:
🛡 Support 1: $0.892
🛡 Support 2: $0.827
🛡 Support 3: $0.747
If #ALPINE manages to break above the wedge resistance with strong volume confirmation, it could trigger a trend reversal with the following upside targets:
🎯 $1.121
🎯 $1.285
🎯 $1.450
🎯 $1.684
🎯 $1.982
⚠️ Always use a tight stop-loss and practice proper risk management.

Alpine F1 Team Fan Token (ALPINE)On the above weekly chart price has corrected over 80% since 2022. A number of reasons now exist to be long. They include:
1) Price action and RSI resistance breakouts.
2) Regular bullish divergence. Multiple oscillators print positive divergence with price action over a 3 month period.
3) Price action confirms support on past resistance.
Is it possible price action corrects further? Sure.
Is it probable? No.
Ww
Type: trade
Risk: 6%
Timeframe for long: now
Return: 400%

A likely move by ALPINEToday, the market looks very optimistic. The week on air opened above 2500, which compensates for sales on a weekly schedule. You can continue to keep working on fantokens to maintain growth in a row. In the absence of a significant market drawdown, an additional wave of purchases of up to 70-100% from current levels is likely. Binance also continues to support this group of instruments by adding futures. There is a possibility of a new announcement regarding atm city acm tomorrow.
To date, the fan token group remains the most undervalued instruments on binance. In addition to ATM AND ACM, which are the most oversold among them, I am considering the work of ALPINE in connection with the recent addition of futures on binance and listings on several small exchanges. These factors can contribute to significant liquidity inflows and growth. A technical signal was also left for a breakdown of the strong resistance of 1.5, which will open the way immediately to 2.5. In an optimistic scenario, an attempt to open above 1.5 in the second half of the quarter can be expected in the next few days, which will pave the way for purchases until the end of the half-year. In a more negative scenario and a drawdown of ether below 1400-1500, there is a possibility of a slight pullback and an attempt to consolidate above 1.5 for ALPINE already in the last days of the month in order to open a new monthly candle above this level. This rollback will provide an additional opportunity to top up the position and make a profit. I would like to draw your attention to the fact that the main level for increasing volatility is 2.5, in case of a breakdown of which there is a possibility of a growth impulse to 5.0 and 7.5.

#ALPINE/USDT#ALPINE
The price is moving within a descending channel on the 1-hour frame, adhering well to it, and is heading for a strong breakout and retest.
We are experiencing a rebound from the lower boundary of the descending channel, which is support at 0.890
We are experiencing a downtrend on the RSI indicator that is about to be broken and retested, supporting the upward trend.
We are looking for stability above the 100 Moving Average.
Entry price: 1.08
First target: 1.10
Second target: 1.20
Third target: 1.35

LISTAUSDT | Rank : 1009👀 Welcome to my Trading View Analysis and Trading Channel Here , we share the latest market analysis, trading signals, and key insights together .
Ready for smarter trades ? ⭐️
⚡️Today , we're going to analyze the ALPINE (Alpine F1 Team Fan Token
) coin together on the daily timeframe and find triggers for our positions .
✨The outlook for the coming days looks very promising . We are witnessing a breakout from the descending trendline , which typically indicates positive changes in price . Additionally , a retest of this trendline has been performed and confirmed that the breakout is genuine and can be trusted .
🚀Moreover , the horizontal resistances that usually hinder price increases have now been cleared , and this is a sign of the strength of the upcoming bullish trend . In lower time frames , a bullish flag pattern has also formed , which generally indicates the potential for further price increases .
📊Given these conditions and the patterns observed in the market , we expect the price to double in the coming days , creating great investment opportunities . Therefore , we can confidently look forward to the bullish trend ahead and be prepared to enter the market! "
I researched this coin on CoinMarketCap on your behalf , and I'm sharing a summary of the information I gathered .
Read carefully , as you need to have this information . 🌈
The Alpine F1 Team Fan Token, also known by the symbol "ALPINE," is a type of non-fungible token (NFT) and fan token associated with the Alpine Formula One team. These tokens allow fans to participate in decisions related to the team and enjoy specific benefits.
### Key Features of the Alpine F1 Team Fan Token:
1. Fan Participation: By holding this token, fans can take part in polls and decisions concerning the team. These decisions may include choosing the color and design of the team's outfits or even naming certain elements of the team.
2. Benefits and Rewards: Holders of fan tokens typically receive special advantages such as ticket discounts, access to exclusive events, or closer interaction with the team.
3. Socio s.com Platform: The Alpine F1 Team fan tokens are usually offered on the Socios .com platform, allowing fans to buy and sell their tokens.
4. Exclusive Experiences: Token holders can gain access to unique and exclusive experiences, such as meeting drivers, attending special events, and more.
These tokens enable fans not only to show their support for the team but also to play a part in the team's management and decision-making processes. For more precise information, it's always recommended to refer to official resources and the team's website.
I love you all so much . 👀
don't forget about capital management and risk management .
Be careful with your positions . 🥇

Alpine showing a week level signal
BINANCE:ALPINEUSDT showing a strong weekly level signal. Don't know the reason why, but enjoy and see if it happens.
Basic information:
Alpine F1 Team a chance to engage with the racing brand. Binance promises that the token will "revolutionize the fan experience" by allowing fans to:
Participate in team voting polls
Hunt digital collectibles and purchase NFTs
Enjoy gamification features tied to fan rewards or great experiences
COINBASE:BTCUSD For long-term level, BTC will also reach a higher level, so be patient and do not use any emergency money to buy a long-term style coin.

Risky RR=4 long ideaPice bounced on a strong support level + breakout of a falling wedge after a formation of a bullish bat pattern + RSI divergence : expecting the price to rise up to 2.7$
PS never risk more than 2% of your capital per trade

Long Trade Position ALPINEUSDTYou are allowed to start a trade when at least one candle closes above the entry point within fifteen minutes. Raise your analytical skills with the targets that I will give you and test your patience and strategy to reach price targets in the demo panel with virtual money. These exercises make you experience profit and loss with targets and stops, virtually in the real market and improve your analysis and personal strategy. Know your fear and greed and gradually control them so that your business is profitable and less harmful. I wish you happiness and wealth

ALPINEUSDT.1DOn this daily chart for ALPINE/USDT, we're presented with an outlook that incorporates the RSI (Relative Strength Index) and MACD (Moving Average Convergence Divergence) indicators along with key levels of support (S1, S2) and resistance (R1, R2).
The RSI, sitting just above the neutral 50 mark at 52.04, suggests a slight bullish bias but indicates that the market is neither overbought nor oversold at the moment. The MACD is almost flat and very close to the zero line, indicating that there is no strong momentum in either direction.
Price action is currently between S1 at $2.000 and R1 at $2.884, with the price at the time of the screenshot at $2.520. This suggests a consolidation phase within this range. The fact that the price is maintaining above the psychological level of $2.000 (S1) could be seen as a potentially bullish signal, as it may serve as a strong support level.
A break above R1 would indicate a potential bullish continuation, possibly heading towards R2. However, if the price breaks below S1, it could suggest a bearish reversal with the possibility of the price moving down to test the next support at S2 ($1.755).
For trading strategies, one might look for confirmation of a breakout above R1 with increased volume as a sign of bullish strength. Conversely, a drop below S1 with significant volume could indicate bearish momentum, and traders might look for short opportunities or exit long positions.
As always, additional analysis of ALPINE’s market conditions and potential news events should be considered in any trading decision. It's also essential to implement a sound risk management strategy, potentially setting stop-loss orders near the S1 level to manage downside risk.

ALPINE ANALYSISFirst of all, note that ALPINE's movements are full of shadows and move slowly.
ALPINE seems to be in a large diametric that has just finished wave D. Wave D appears to have been a triangle.
The green area is a suitable place for a buy/long position.
Closing a daily candle below the invalidation level will violate the analysis
For risk management, please don't forget stop loss and capital management
When we reach the first target, save some profit and then change the stop to entry
Comment if you have any questions
Thank You

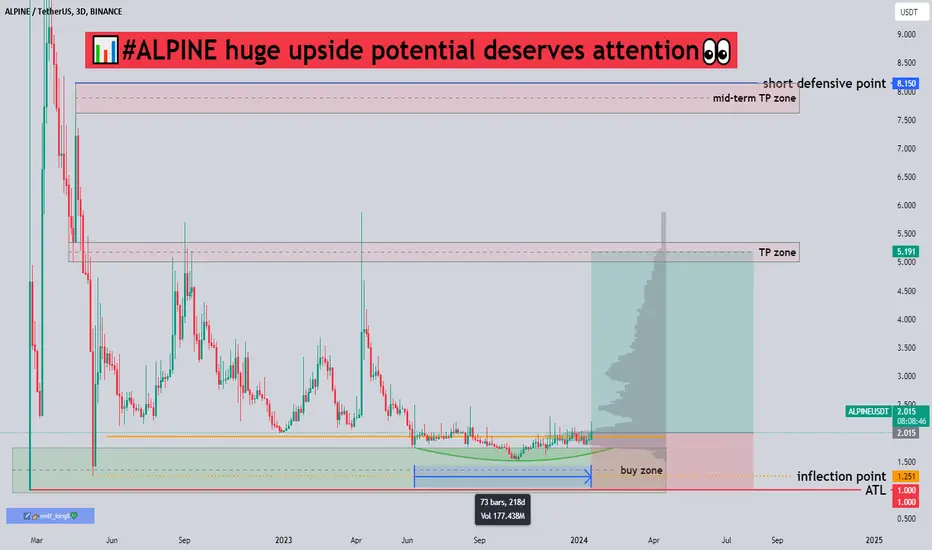
📊#ALPINE huge upside potential deserves attention👀🧠It is not difficult to find from the chart that we have been at the bottom for a long time. In this bullish craze, fan tokens do not seem to perform very well. Hot sectors are all rotating. After all, the funds in the market are turning from bear to bull. Once the bull market starts, the funds flowing into the market will increase sharply, so sectors that have not yet performed are worthy of our ambush.✔️
➡️From a technical perspective, we have been consolidating sideways near the buying zone for about 218 days, and there are signs of gradual increase, so we can consider using DCA to buy. If TP1 develops as expected, then our rate of return will be Can achieve 160%+ or more💥
🤜If you like my analysis, please like 💖and share it💬
💕 Follow me so you don't miss out on any signals and analyze 💯
Possible scenario for alpineBuy after the daily close of purple line .
Or if the channel fails buy in zone below.
DYOR.

ALPINEUSDT.1HBased on the given market data, ALPINE is currently trading at $1.983 against USDT.
The 4-hour chart shows that the Relative Strength Index (RSI) is at 69.59, which is close to the overbought territory (above 70) and could indicate a potential price pullback. The Moving Average Convergence Divergence (MACD) is slightly negative (-0.001), suggesting a bearish trend. The current price is slightly below the upper Bollinger Band (BB) of $1.997, which often suggests a potential pullback towards the mean.
In terms of support and resistance levels on the 4-hour chart, the first, second, and third support levels are at $1.917, $1.883, and $1.809 respectively. The first, second, and third resistance levels are at $2.112, $2.180, and $2.300 respectively.
On the daily chart, the RSI is at 55.52, indicating a more balanced market. The MACD is positive (0.018) which suggests a bullish trend. The current price is below the upper Bollinger Band at $2.062, indicating room for potential upside.
The support levels on the daily chart are at $1.886, $1.800, and $1.761, while the resistance levels are at $2.117, $2.192, and $2.300.
On the weekly chart, the RSI is at 49.36, indicating a balanced market, and the MACD is negative (-0.070), suggesting a bearish trend. The support levels are at $1.817, $1.601, and $1.500, while the resistance levels are at $2.210, $2.310, and $2.475.
In conclusion, ALPINE is showing mixed signals across different time frames. The short-term 4-hour chart is indicating a potential price pullback, while the daily chart suggests room for potential upside. The weekly chart suggests a bearish trend. Therefore, it is recommended to monitor the market closely and make decisions based on further market movements and individual risk tolerance.

ALPINEUSDT"As we enter the bullish season, the initial target to aim for is
target : 38 🎯.
This is based on a combination of technical analysis indicators and market trends.
However, it's important to approach trading with caution and adapt to changing market
conditions.
Keep an eye on key support and resistance levels, as well as any significant news or events that may impact the market.
Remember to use proper risk management techniques and consider setting profit targets along the way.
Happy trading!"

ALPINE| On a rebound from the support levelHello trader! Today I have a new idea for you. Like and subscribe to the channel, there is a lot of useful information there.✅
Locally, the coin has lost a strong % in price; the buyer can become active near the 0.236 Fibonacci zone. You can try to go a little higher than the level.
Deal plan:
Entrance - 1.760/1.730$
Stop - $1.653
Take - $1.9
Guys, don’t forget about risk management and follow the risks!

Alpine_LongYou can see Alpine over it's entire time on Kucoin has been working toward this breakout. Imagine it'll be a big move upcoming for this coin!

Alpina Next Move: Grab the Bull by the Horns! 🚀 - A Strategic B**Alpine Coin: Short Fundamental Analysis and Recent News**
**Fundamental Analysis**
* Alpine Coin is a decentralized cryptocurrency that is designed to be a medium of exchange and a store of value.
* Alpine Coin is based on the Bitcoin blockchain and uses the same proof-of-work consensus mechanism.
* Alpine Coin has a total supply of 21 million coins, of which approximately 18.5 million coins are currently in circulation.
* Alpine Coin is currently trading at around $0.000002 USD.
* Alpine Coin is a low-market-capitalization cryptocurrency, with a market cap of around $37,000 USD.
**Recent News**
* Alpine Coin has recently been listed on several new exchanges, including Cryptopump and CoinMetro.
* Alpine Coin has been featured in several news articles, including a piece on CoinDesk.
* Alpine Coin has been the subject of a number of social media discussions, with many users expressing positive sentiment towards the project.
**Disclaimer**
The information provided in this short fundamental analysis and recent news article is for informational purposes only and should not be considered investment advice. Please conduct your own research before making any investment decisions.
**Disclaimer
To date, there is no evidence that Alpine Coin has been the subject of any negative news or social media discussions. However, it is important to note that Alpine Coin is a low-market-capitalization cryptocurrency and, as such, is more susceptible to price volatility. Investors should be prepared to lose their entire investment when investing in Alpine Coin.
Please let me know if you have any other questions.

ALPINEUSDT 3D LONG📈Hi all. Timeframe 3 days. ALPINEUSDT is at support. I consider a long position during a breakdown/retest of a trend line. Or a set to the spot now with an addition from the lower level. Marked targets and levels on the chart.

ALPINEUSDTALPINEUSDT is in good bullish momentum and respecting very well the bullish trendline.
Currently the price is retracing previous bullish leg and 50% fib retracement will be technically good for another bullish leg.

Alpine can make 100% to 300%it touched the support area (Buy Zone > $2 - $2.25) and is still close to it ($2.5)
Targets can be near to $3.5 - $5 - $8 - $11
Good Luck

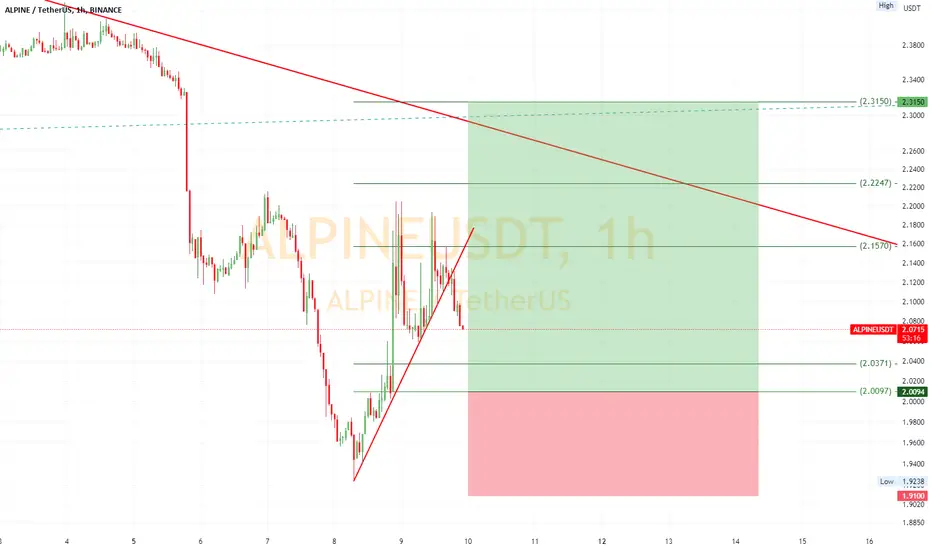
#ALPINE🔰#ALPINE - Crypto - MEXC
🟩 BUY TRADE !
🔸 Refill from the golden zone.
🔸 After Achieving 1st target (5%), Move stop lose to entry.
🔸 Stop loss after the close of the 4-hour candle.
🔸 Buy Between : 2.04 - 2.00
🔸Targets : 2.189 - 2.26 - 2.37
🚫 Stop Loss : 1.91
🔖 stop loss after the close of the 4-hour candle
—
TDAWLY ©