ALT/BTCAlt coins or Bitcoins what to do, what to do?
Taking a look at ALT/BTC, I can see from my house that ALT coins are near rock bottom prices. Is this a golden opportunity behind a mask with a face of uncertainty or the end of Alt coins? I predict an all time high eventually. Stay tuned!
Related coins

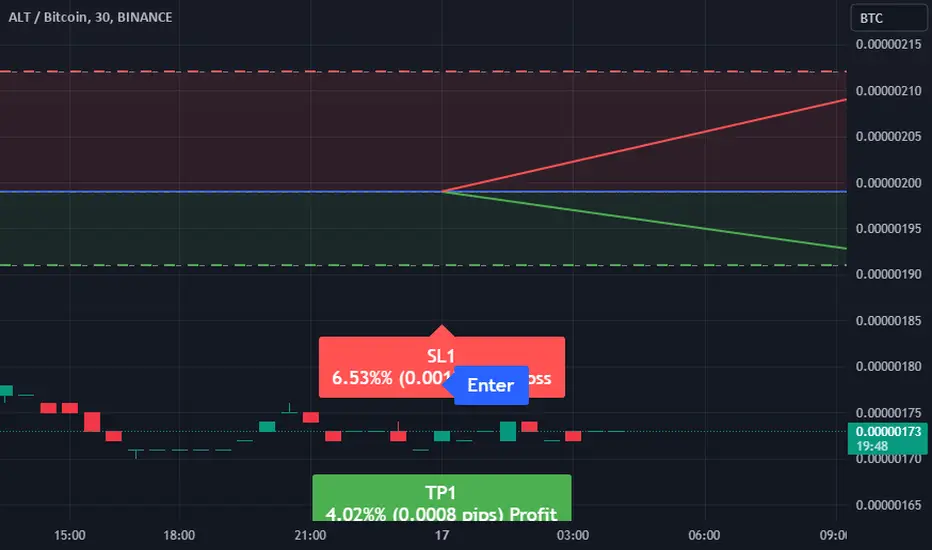
Trade Signal for ALTBTC - Direction: SellTraders, our analysis utilizing the EASY Quantum Ai Strategy has identified a potential Sell opportunity for the ALTBTC currency pair. Here are the details for this trade:
- Enter Price: 1.99E-06
- Take Profit: 1.91E-06
- Stop Loss: 2.12E-06
The decision to recommend a Sell is based on
Altlayer Bullish | 185% - 265% BU-Pot., Easy!➢ Altlayer (ALTBTC) broke out of another classic, yet very strong, falling wedge pattern. Notice how a "cup" pattern forms to signal that the bottom is in. This is marked yellow on the chart.
➢ The falling wedge ends in a cup pattern, the cup pattern is followed by very strong bullish action. This

ALTLAYER with BTC pair (investing chart)hello dear trader and investors
About Altlayer :
AltLayer is an open and decentralized protocol for rollups. AltLayer brings together a novel idea of Restaked Rollups which takes rollups (spun from any rollup stack such as OP Stack, Arbitrum Orbit, Polygon CDK, ZK Stack, etc.) and provides them with

Altlayer Bullish | 185% - 265% BU-Pot., Easy!➢ Altlayer (ALTBTC) broke out of another classic, yet very strong, falling wedge pattern. Notice how a "cup" pattern forms to signal that the bottom is in. This is marked yellow on the chart.
➢ The falling wedge ends in a cup pattern, the cup pattern is followed by very strong bullish action. This

Possible bearish crypto trendHi all, I'm a bit new here and going to try my hand at some general analysis rather than for any specific crypto asset. I appreciate any feedback and thoughts on this. On this chart is alt coin to bitcoin conversion. I've overlaid BTC/USD and ALT/USD as well. In general these tend to follow each

See all ideas
Summarizing what the indicators are suggesting.
Oscillators
Neutral
SellBuy
Strong sellStrong buy
Strong sellSellNeutralBuyStrong buy
Oscillators
Neutral
SellBuy
Strong sellStrong buy
Strong sellSellNeutralBuyStrong buy
Summary
Neutral
SellBuy
Strong sellStrong buy
Strong sellSellNeutralBuyStrong buy
Summary
Neutral
SellBuy
Strong sellStrong buy
Strong sellSellNeutralBuyStrong buy
Summary
Neutral
SellBuy
Strong sellStrong buy
Strong sellSellNeutralBuyStrong buy
Moving Averages
Neutral
SellBuy
Strong sellStrong buy
Strong sellSellNeutralBuyStrong buy
Moving Averages
Neutral
SellBuy
Strong sellStrong buy
Strong sellSellNeutralBuyStrong buy
Displays a symbol's price movements over previous years to identify recurring trends.