ALT/USDT +200%ALT recently delivered a powerful +100% pump, showcasing the strength of the $0.024 – $0.025 demand zone. After a healthy 50% retracement from the previous leg up, price action is now stabilizing and forming a new support base around the $0.025 – $0.026 zone — a classic setup for the next major move
Related pairs

ALTUSDT Forming Falling WedgeALTUSDT has recently completed a breakout from a well-formed falling wedge pattern, a strong bullish technical signal that often precedes significant upward momentum. The wedge breakout is backed by a noticeable spike in trading volume, adding credibility to the move and indicating growing market pa

Altcoins Market Bull Market Confirmed, AltLayerThis is just one, another one, but this theme will continue to repeat over and over, again and again.
Here AltLayer is producing a three digits strong bullish breakout; the highest volume ever today and this confirms the start of the 2025 altcoins market bull market.
Total growth amounts to more t

Alt rivers and jump in terminal mood pattern Daily chart Finishing a terminal fractal While the downtrend is expansive The flat waves and patterns promise a near 100% uptrend The 4-hour chart is completing a flat terminal pattern According to the pattern, it could overshadow today's price from tomorrow and continue to grow until the price targ

$ALT Breaks 136-Day Resistance — Big Rally Loading?#ALT has officially broken above the 136-day-long resistance.
Price is now consolidating above the breakout zone, showing strength.
If momentum continues, a major rally could be ahead.
Watching closely for confirmation of the next move.
NASDAQ:ALT BINANCE:ALTUSDT

ALTUSDT 1D AnalysisALT ~ 1D Analysis
#ALT This trade is very risky NASDAQ:ALT Trying to penetrate this resistant line, Buy if successfully penetrate this resistant line with a large volume to avoid false breakout.

Turn off the fear and thinkLook closely: on the left is ALTLAYER, essentially a gem of the current cycle; on the right is HARMONY, a gem of the previous cycle. What unites them? They’re united by a 96% dump. But what happened next? Harmony, from the COVID wick, did a 300x. Now, let’s think: if we cut that 300x down to 100x, i

ALT looks bearish for mid-term (1D)ALT appears to be in a large-degree bearish wave C. If it reaches the red zone, we can look for a sell/short position targeting lower levels.
The minimum time required for wave C to complete is marked by the vertical line on the chart. Keep in mind that this is the minimum duration—if the wave exte

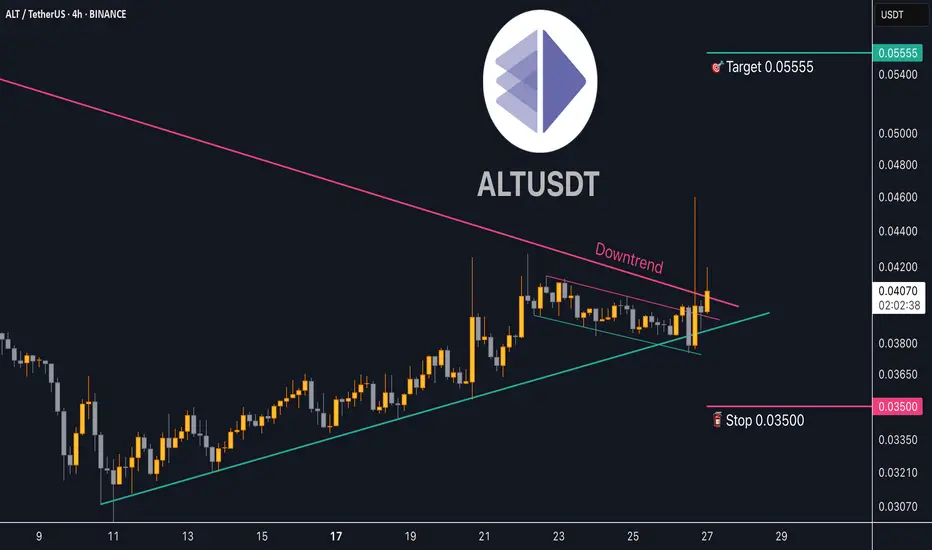
Trading opportunity for Altlayer ALTUSDTBased on technical factors there is a Buy position in :
📊 ALTUSDT
🔵 Buy Now
🪫Stop loss 0.03500
🔋Target 0.05555
📏 R/R 2,4
💸RISK : 1%
We hope it is profitable for you ❤️
Please support our activity with your likes👍 and comments📝
ALT ( SPOT - INVEST )BINANCE:ALTUSDT
ALT / USDT
1D time frame
analysis tools
____________
SMC
FVG
Trend lines
Fibonacci
Support & resistance
MACD Cross
EMA Cross
______________________________________________________________
Golden Advices.
********************
* Please calculate your losses before any entry.
* Do

See all ideas
Summarizing what the indicators are suggesting.
Oscillators
Neutral
SellBuy
Strong sellStrong buy
Strong sellSellNeutralBuyStrong buy
Oscillators
Neutral
SellBuy
Strong sellStrong buy
Strong sellSellNeutralBuyStrong buy
Summary
Neutral
SellBuy
Strong sellStrong buy
Strong sellSellNeutralBuyStrong buy
Summary
Neutral
SellBuy
Strong sellStrong buy
Strong sellSellNeutralBuyStrong buy
Summary
Neutral
SellBuy
Strong sellStrong buy
Strong sellSellNeutralBuyStrong buy
Moving Averages
Neutral
SellBuy
Strong sellStrong buy
Strong sellSellNeutralBuyStrong buy
Moving Averages
Neutral
SellBuy
Strong sellStrong buy
Strong sellSellNeutralBuyStrong buy
Frequently Asked Questions
The current price of Altlayer / USDT (ALT) is 0.031240 USDT — it has fallen −0.64% in the past 24 hours. Try placing this info into the context by checking out what coins are also gaining and losing at the moment and seeing ALT price chart.
Altlayer / USDT price has risen by 19.42% over the last week, its month performance shows a −58.31% decrease, and as for the last year, Altlayer / USDT has decreased by −58.31%. See more dynamics on ALT price chart.
Keep track of coins' changes with our Crypto Coins Heatmap.
Keep track of coins' changes with our Crypto Coins Heatmap.
Altlayer / USDT (ALT) reached its highest price on Jun 16, 2025 — it amounted to 0.074940 USDT. Find more insights on the ALT price chart.
See the list of crypto gainers and choose what best fits your strategy.
See the list of crypto gainers and choose what best fits your strategy.
Altlayer / USDT (ALT) reached the lowest price of 0.025770 USDT on Jun 26, 2025. View more Altlayer / USDT dynamics on the price chart.
See the list of crypto losers to find unexpected opportunities.
See the list of crypto losers to find unexpected opportunities.
The safest choice when buying ALT is to go to a well-known crypto exchange. Some of the popular names are Binance, Coinbase, Kraken. But you'll have to find a reliable broker and create an account first. You can trade ALT right from TradingView charts — just choose a broker and connect to your account.
Altlayer / USDT (ALT) is just as reliable as any other crypto asset — this corner of the world market is highly volatile. Today, for instance, Altlayer / USDT is estimated as 0.64% volatile. The only thing it means is that you must prepare and examine all available information before making a decision. And if you're not sure about Altlayer / USDT, you can find more inspiration in our curated watchlists.
You can discuss Altlayer / USDT (ALT) with other users in our public chats, Minds or in the comments to Ideas.