ALT/USDT - Parabolic moveis preparing for its next parabolic move. Over the past 10 days, price has established a solid base support around the $0.033 zone, consolidating in a tight range. This accumulation structure suggests that a breakout and strong upward leg could be imminent.
ALTUSDT trade ideas
ALT- Trading idea.
Altlayer - emerges as a decentralized protocol designed to revolutionize the blockchain landscape by simplifying the launch of native and restaked rollups. These rollups, which can be based on optimistic or zk-rollup stacks, benefit from enhanced security, decentralization, and interoperability. The protocol’s innovative approach includes the concept of restaked rollups, leveraging mechanisms from various rollup stacks such as OP Stack, Arbitrum Orbit, Polygon CDK, and ZK Stack.
A key feature of Altlayer is its native utility token, ALT, which serves multiple functions within the ecosystem. ALT is used for economic bonding, governance, protocol incentives, and payment of protocol fees. This tokenomics model ensures that ALT holders play a significant role in maintaining and managing the network.
Binance Labs has invested in this coin.
-----------------------------------------------------
✅ The previous trading idea closed only one sell zone, gaining +97% since publication. The remaining position was stopped out around +70%.
⤵️ The price then retraced back into the descending channel, following the overall market sentiment.
Logically, there are a few possible scenarios:
1️⃣ - A sideways range starts to form (a channel within a channel).
2️⃣ - A V-shaped recovery from the current levels.
3️⃣ - A continued decline within the descending channel.
🛒 From the allocated amount for this coin and the previously locked-in profit, I’m starting to build a position.

ALTUSDT Forming Potential BreakoutALTUSDT is shaping up to be an interesting opportunity for crypto traders watching for potential breakout plays. The pair has recently tested a strong horizontal support zone multiple times, forming a solid base around that level. This accumulation range is a key area where buyers seem to step in aggressively, suggesting that a bounce and a trend reversal could be on the horizon. The technical outlook points toward a projected gain of around 90% to 100%+, which could attract more traders looking for high risk-to-reward setups in the altcoin market.
The trading volume remains healthy on ALTUSDT, confirming that there’s good liquidity and market participation to fuel a potential rally. When volume supports the price action like this, it generally adds strength to the bullish case. Many traders keep an eye on such setups because once the price breaks out from the consolidation phase, it often does so with momentum that can yield quick returns. The chart also shows early signs of a move upward with bullish candles forming off the support zone.
Investors are increasingly taking interest in the project behind ALTUSDT, drawn not just by its technical potential but by the community sentiment and developmental updates. This is critical because strong fundamentals combined with a bullish technical pattern can create the perfect storm for a powerful price surge. As the crypto market enters a more optimistic phase, coins like ALTUSDT could see amplified moves as traders look to rotate capital into promising altcoins with clear breakout setups.
✅ Show your support by hitting the like button and
✅ Leaving a comment below! (What is You opinion about this Coin)
Your feedback and engagement keep me inspired to share more insightful market analysis with y

ALT/USDT +200%ALT recently delivered a powerful +100% pump, showcasing the strength of the $0.024 – $0.025 demand zone. After a healthy 50% retracement from the previous leg up, price action is now stabilizing and forming a new support base around the $0.025 – $0.026 zone — a classic setup for the next major move.
With bullish structure starting to rebuild, this could be the early stage of a fresh leg up, offering a potential +200% upside from current levels.
Entry Zone: $0.025 – $0.026 (Current Market Price)
DCA Zone: $0.023 – $0.026
Targets:
• TP1: $0.0322
• TP2: $0.0368
• TP3: $0.0415
Stop Loss: Below $0.022 (adjust based on personal risk)

ALTUSDT Forming Falling WedgeALTUSDT has recently completed a breakout from a well-formed falling wedge pattern, a strong bullish technical signal that often precedes significant upward momentum. The wedge breakout is backed by a noticeable spike in trading volume, adding credibility to the move and indicating growing market participation. This classic reversal pattern suggests that a major trend shift could be underway, and price projections indicate a potential gain in the range of 70% to 80%, aligning with historical performance of such breakouts.
What makes this setup more compelling is the structure of the wedge itself—tight, consistent, and with clear lower highs and lower lows, followed by a strong bullish candle cutting through resistance. This is a textbook example of a bullish breakout where the price decisively exits the consolidation zone and starts trending upward. With volume confirming the breakout, many traders see this as an early-stage rally signal with room to grow.
Investor sentiment around ALTUSDT is gaining strength, particularly on social platforms and trading communities. This surge in attention could fuel further buying pressure, particularly as the breakout becomes more visible to retail and technical traders. ALTUSDT has shown the ability to move sharply during bullish phases, and this breakout could signal the beginning of a new leg higher, especially if it maintains momentum over the next few daily closes.
With strong technical structure, increasing investor interest, and supportive volume, ALTUSDT is shaping up to be one of the stronger bullish breakout candidates in the current market environment. Traders looking for high-reward setups may find this an ideal entry point with a well-defined technical framework and attractive upside potential.
✅ Show your support by hitting the like button and
✅ Leaving a comment below! (What is You opinion about this Coin)
Your feedback and engagement keep me inspired to share more insightful market analysis with you!

Altcoins Market Bull Market Confirmed, AltLayerThis is just one, another one, but this theme will continue to repeat over and over, again and again.
Here AltLayer is producing a three digits strong bullish breakout; the highest volume ever today and this confirms the start of the 2025 altcoins market bull market.
Total growth amounts to more than 115% in the past few hours. This is similar to what we saw with Ravencoin and Axelar, these projects produced three digits green in a single day and the market is producing a bullish continuation on those, here it will do so as well.
This is only the start, prepare for maximum growth.
If you enjoy the content, consider hitting follow. I will be sharing new altcoins daily for year to come.
Namaste.

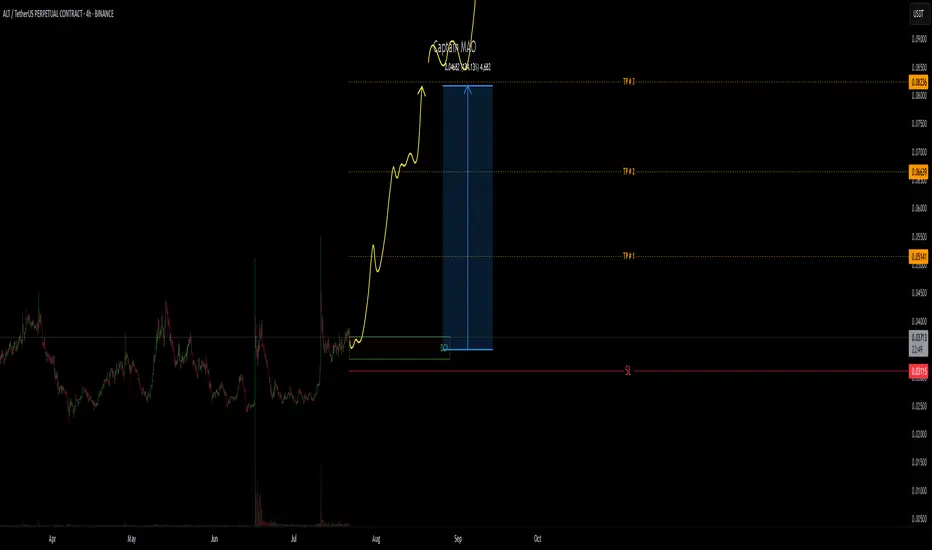
Alt rivers and jump in terminal mood pattern Daily chart Finishing a terminal fractal While the downtrend is expansive The flat waves and patterns promise a near 100% uptrend The 4-hour chart is completing a flat terminal pattern According to the pattern, it could overshadow today's price from tomorrow and continue to grow until the price target is above the resistance level of 150

$ALT Breaks 136-Day Resistance — Big Rally Loading?#ALT has officially broken above the 136-day-long resistance.
Price is now consolidating above the breakout zone, showing strength.
If momentum continues, a major rally could be ahead.
Watching closely for confirmation of the next move.
NASDAQ:ALT BINANCE:ALTUSDT

ALTUSDT 1D AnalysisALT ~ 1D Analysis
#ALT This trade is very risky NASDAQ:ALT Trying to penetrate this resistant line, Buy if successfully penetrate this resistant line with a large volume to avoid false breakout.

Turn off the fear and thinkLook closely: on the left is ALTLAYER, essentially a gem of the current cycle; on the right is HARMONY, a gem of the previous cycle. What unites them? They’re united by a 96% dump. But what happened next? Harmony, from the COVID wick, did a 300x. Now, let’s think: if we cut that 300x down to 100x, it turns out that ALTLAYER could very well have a 100x potential baked into it for this cycle. But who’s going to say that right now? No one. They’ll tell you a recession is coming soon, that tariffs are an issue—basically, they’ll throw all sorts of scare tactics at you.

ALT looks bearish for mid-term (1D)ALT appears to be in a large-degree bearish wave C. If it reaches the red zone, we can look for a sell/short position targeting lower levels.
The minimum time required for wave C to complete is marked by the vertical line on the chart. Keep in mind that this is the minimum duration—if the wave extends, it may take longer.
A daily candle closing above the invalidation level will invalidate this analysis.
For risk management, please don't forget stop loss and capital management
Comment if you have any questions
Thank You

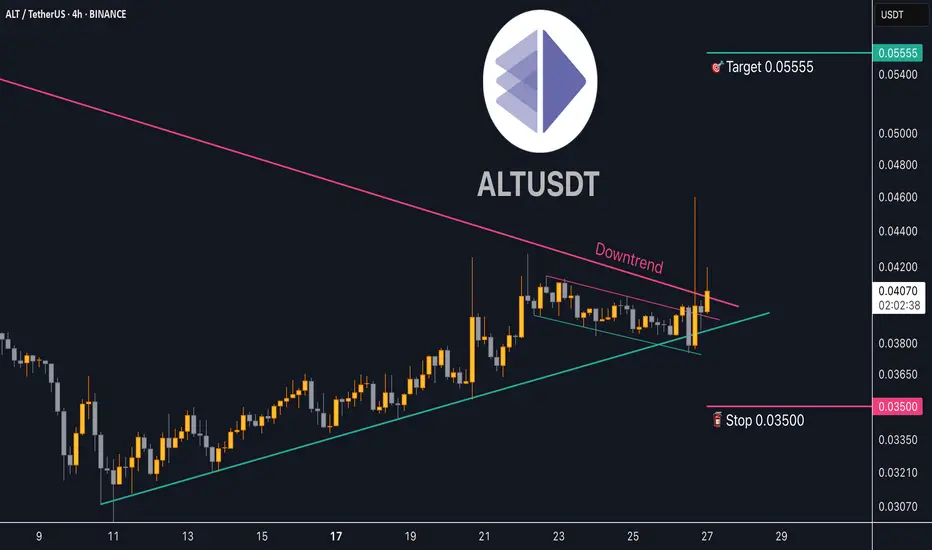
Trading opportunity for Altlayer ALTUSDTBased on technical factors there is a Buy position in :
📊 ALTUSDT
🔵 Buy Now
🪫Stop loss 0.03500
🔋Target 0.05555
📏 R/R 2,4
💸RISK : 1%
We hope it is profitable for you ❤️
Please support our activity with your likes👍 and comments📝
ALT ( SPOT - INVEST )BINANCE:ALTUSDT
ALT / USDT
1D time frame
analysis tools
____________
SMC
FVG
Trend lines
Fibonacci
Support & resistance
MACD Cross
EMA Cross
______________________________________________________________
Golden Advices.
********************
* Please calculate your losses before any entry.
* Do not enter any trade you find it not suitable for you.
* No FOMO - No Rush , it is a long journey.
Useful Tags.
****************
My total posts
www.tradingview.com

$ALTUSDTKey Observations
Price Action & Trend:
Recent price action shows consolidation between 0.03952 (current level) and 0.04372, indicating potential up side.
Critical Support & Resistance Levels:
Major resistance levels: 0.08000 and 0.11477 (previous breakdown zones).
Market Sentiment:
Consolidation near 0.04095–0.04372 hints at potential exhaustion. Watch for reversal signals (e.g., bullish divergence, volume spikes).
Key Scenarios
Targeting 0.11 first
Bullish signals
Huge falling wedge
1D:
RSI Oversold
4HR:
Price / EMA10 bullish cross
Engulfing candlestick pattern
1HR:
Doji candlestick pattern
Long Legged Doji candlestick pattern
Spinning Top candlestick pattern

ALTUSDT bullish outlookAltlayer looks promising after the retest on the descending trendline.
Breakout will be confirmed after 0.17.
Targets -> 0.29 and 0.36
Invalidation -> below 0.11

ALT/USD – Key Technical UpdateRecent Price Action:
ALT has seen a significant decline, with bulls looking for support amid intensified bearish pressure. The recent drop highlights vulnerability, but key support levels below could provide a foundation for recovery.
Key Levels to Watch:
Support Levels:
$0.08500: Immediate support zone where bulls are attempting to stabilize.
$0.07810: A prior swing low with historical buying interest.
$0.07150, $0.07000, $0.06650: Critical levels marking past swing lows. A deeper move into these zones could attract aggressive buying, especially near $0.06650, aligning with August 5th’s swing low.
Resistance Levels:
$0.08790: Near-term resistance likely to cap immediate recovery efforts, with confluence from recent bearish gaps.
$0.11131: A stronger resistance zone near January 17th’s swing high, which aligns with prior bearish momentum.
Market Dynamics:
Token Unlock Impact:
The upcoming Saturday token unlock is expected to increase supply, potentially exacerbating downside pressure in the short term. However, following the release, the market could stabilize, setting the stage for a relief rally as bearish momentum wanes.
Bearish Gaps:
Resistance from daily bearish gaps adds confluence near $0.08790 and $0.11131, making these levels critical to monitor during any rally.
Outlook:
Bullish Scenario:
A successful defense of $0.08500 or a deeper dip into the $0.07150–$0.06650 range, followed by strong buying momentum, could lead to a relief rally. Clearing $0.08790 would open the door to a move toward $0.11131 or higher.
Bearish Scenario:
A sustained break below $0.06650 would invalidate key supports, exposing ALT to further downside risks, with no clear structural floor below.
Conclusion:
The focus remains on $0.08500 as the immediate support zone, while Saturday's token unlock is likely to influence price action significantly. A relief rally may emerge post-unlock, targeting $0.08790 and possibly $0.11131 if the bearish gaps are filled. For now, caution is advised as the market navigates increased supply pressure.

ALTUSDT 3DALT ~ 3D
#ALT So far it still maintains this support block,. If you still have Conviction on this coin,. Buy from here with a minimum target of 20%+

ALT Leading Diagonal
▶️ I view the upward movement starting in August as a leading diagonal.
▶️ This suggests a new ABC pattern upwards for black 5.
▶️ Note that Black 4 might still be ongoing, potentially leading to another drop to test the bottom ascending trendline.

$ALTUSDT - Expecting a high rise breakout from the triangleBINANCE:ALTUSDT - Looking pretty much bullish from this zone, expecting a breakout from the triangle. Upper TF's too validating the fact. Time to see what happens,

ALT is bullish now, Neckline brokenALT can easily get to TP-1 which is 7.
Below are the reasons that TON can rise up from here.
Bullish divergence at the bottom
Double bottom pattern
Broken the neckline
Good luck and stay blessed!

Now is the time to buy ALT for at least a 300% profit spot tradeBINANCE:ALTUSDT is one the altcoins that I have bought for myself for the 2025 bullmarket. I believe it has a great potential. My price target is again the all time highs and I am not seeking anything crazy or far fetched. Can it go even higher? Probably but I want to invest my money safely.

ALTUSDT Daily time frameFollowing similar pattern after breakout from accumulation zone, ALT is ready for breakout and pa ossible 85% target is shown with strict stop loss.

#Altlayer $ALT#Altlayer NASDAQ:ALT
Breakout of the rounding bottom accumulation on 3D timeframe👀
Also breaking through the SuperGuppy dynamic resistance☝️
Trend switched to bullish📈
🎯1 Target - 0.30795$
🎯2 Target - 0.57370$
🎯3 Target - 1.08670$
