#AMBUSDT.P - Has a bearish wolf patternHello traders !
If we look at the history of the #AMBUSDT.P chart, we see that the Bearish Wolf Pattern is working very well. And persistently our coin continues to draw the same patterns. For this reason, history repeats itself and I hope that it will fall in the same way in accordance with the pattern and leave us good profits.
Good luck to everyone.
-- No sharing here is not investment advice!
AMBUSDT trade ideas

AMBUSDT ShortingI'm shorting if price break above USD0.01015.
A lot of short seller might turn into buyer at that point. Especially when price is moving away from USD0.01000.

ambThe currency trend is corrective. But in the first green line, there is a small support that can be done up to the resistance desired by the board and correction towards the lower lines.

AMP Trading PlanShort Scenario
Horizontal supp/resis/TP lines in yellow
50Day EMA
Ascending RSI support line
Ascending Support line

BUY-ZONE : BY LOW CH & BREAKEVENIn the areas where we can give more importance to buying, the price can be 0.009 dollars, which can climb up to the price ceiling of 0.0145 dollars.

AMB ready for correctionDespite numerous unsuccessful and failed tries to break the heavy resistance zone specially considering the bitcoin chart I expect at least a minor correction from my entry point.
NFA

AirDAO (AMB) - Bullish divergenceOn the above 2-day chart price action has corrected over 80% since the beginning of the year. A number of reasons now exist to consider a long position, including:
1) Price action and RSI resistance breakouts.
2) Price action backtests past resistance as support.
3) Price action tests the ‘bottoming candle’.
4) Regular bullish divergence.
Was asked about this one, seems bullish enough but has very small market cap.
Is it possible price action falls further? Sure.
Is it probable? No
Type: Trade
Risk: <=2-3%
Timeframe: Act now
Return: Don’t know

AMB is so Bullish This is the potential outcome if the five-year downtrend is breached.
Chart Patterns: triple bottoms, bullish engulfing patterns.
Support and Resistance Levels: The price found buying interest.
Moving Averages: 50-day moving average crossing above the 100-day moving average.
Relative Strength Index (RSI): A rising RSI from oversold levels (potential uptrend).
Volume Analysis: increasing volume.
Confirmation: Trend reversal on multiple indicators.
Good luck

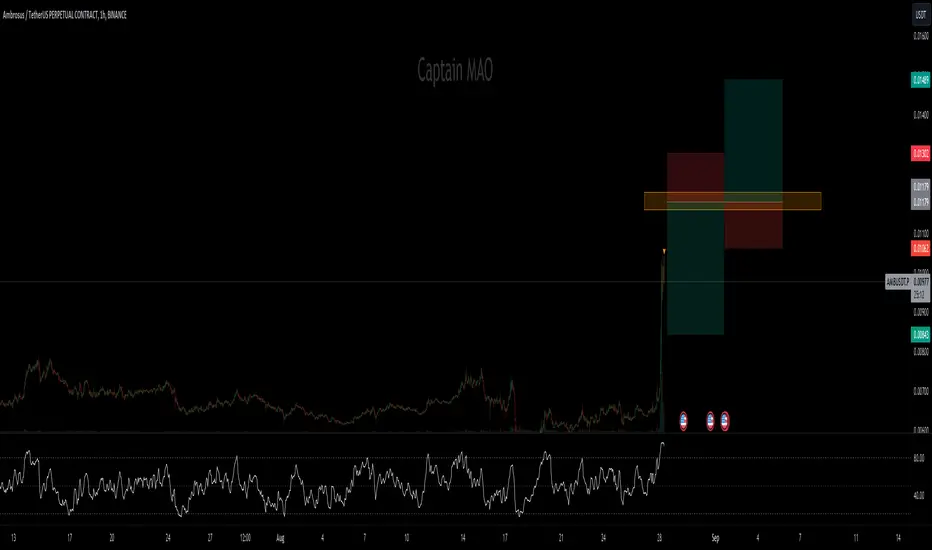
AMB AMBUSDT AirDao Long Opportunity Sep 29Signal: Red -> Green
Context: Green
Momentum is strong
Risk-Reward: 2.99
DISCLAIMER
This is only a personal opinion and does NOT serve as investing NOR trading advice.
Please make your own decisions and be responsible for your own investing and trading Activities


AMB approaching a strong resistance levelAirDAO AMB price is in pace of approaching a strong resistance. The line is proven its firmness, highlighted in red, the bounce areas dating back to 15th of March of this year, that's past 6 months as of the day of this writing.
In a technical perspective, we could still see a continuation of its bullish trend if we see a resistance breakout and if not, sell on bounce area with confirmation of a breakdown as well. I also made a diagonal support below as a guide. The RSI indicates that the coin price is near oversold.
Happy trading and always plan your trades by putting a take profit and stop loss areas in every position.

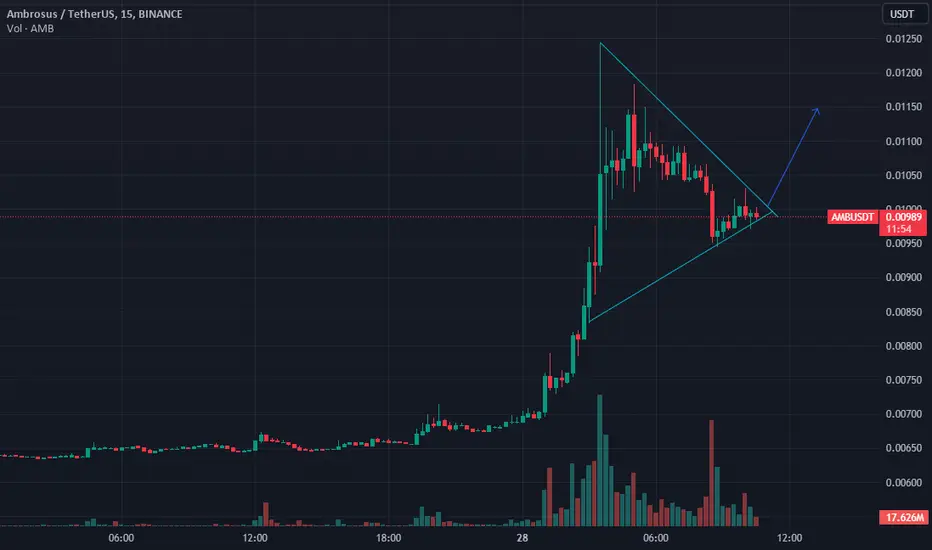
AMB going UPThe AMB coin is in a local uptrend and has formed a bullish triangle pattern, which is noticeable by the recent price lows rising to the resistance level. For a few touches to the level, I expect to see the participants' stop orders behind it. At the same time, increased purchase volumes enter the tool, confirming the interest of participants. Before entering the deal, I am waiting for a traded movement near the level and active purchases in the feed before the breakdown.

AMb Lights the Path: Get In on the Buy Action TodayWelcome to our crypto exploration hub! We're here to navigate the exciting world of digital assets, providing you with comprehensive insights into market dynamics and potential trading opportunities.Our mission is to decode the crypto market's mysteries and equip you with the knowledge you need to make informed investment choices. From the latest developments in Bitcoin to the hidden potential of various altcoins, we're your trusted source for daily technical analysis.While technical analysis is a valuable tool, it's important to remember that it's just one piece of the puzzle. We encourage you to take a well-rounded approach to your investments, considering factors like macroeconomic trends, news, and community sentiment.Join us for the freshest analyses, and don't hesitate to join the conversation in the comments below. Keep in mind that our content is purely for educational purposes and should not be construed as financial advice. Always integrate it into your broader investment strategy."

AMBUSDTAMBUSDT is in bullish trend.
Printing HH and HL.
No sign of reversal from here.
We wait and watch for the breakout of last HH.


Long AmbAmb has just bounced off the 0.618 Fib level with strong volume behind it. I'm currently eyeballing a retest of this crucial resistance zone. The .618 retracement will fuel this Wave 3 move. Wave 3 is traditionally the most powerful and dynamic of the five-wave cycle. Given this, I'm anticipating a significant push to the upside. I feel confident in my target based off all the analysis I have.
This chart based off of The Elliot Wave Theory, Fibonacci, EMA’s, MacD , RSI , Momentum, and resistance/support zones combined with patterns.

AMB 4HAMB
It is in an upward trend with a gentle slope
Special spot deals
Follow to take advantage of the signals

AMB retrace LONGUsing support resistance and recent high volume, we can long in this position and take a stop at the support.

Amb Sell Trade on Retest.Here is My study on AMB.
Welcome to my channel! Here you'll find daily technical analysis ofthe latest trends in the crypto market. From Bitcoin to altcoins, I'lIl be sharing my insights and predictions to help you make informed decisions
about your investments. Follow me for the latest updates and join the conversation in the comments!
Crypto technical analysis uses past price history to predict future price. It's not a guarantee and shouldn't be relied on solely for investment decisions. Consider other factors such as market trends, economic strength and
information dissemination. Use with caution.
This Is Not A Finacial Advise

AMB/USDTAmb moved 55% in short time without any correction ,what i can see this not pair not a good choice to trade not for long not for short ,decision area looking for short or long is 0.0115-0.012 $ .this kind move is not for trade
AMB has Bullish triangleThe instrument is in the growth leaders, after the upward movement it is in the phase of reaccumulation and presumably forms a bullish rally base rally pattern, a resistance level is also formed, right at which the Value Area High is located, large prints for purchase and density are at the level in the glass, with a smooth approach, preload and increased activity in the glass, I expect an impulse output to long with the withdrawal of liquidity by level. Goal 0.011
AIRDAO correction to the downside ❌🧨Hello 🐋
based on the chart, we can see explosive and new volume for the price and break out of the descending channel and red trend line to the upside 📖💡
for
first target definitely we expect more correction to the downside and retest of the support area ❌🧨
Please, feel free to share your point of view, write it in the comments below, thanks 🐋

AMBUSDT needs to create a clear breakoutThe price of AMBUSDT is currently positioned near the critical level of $0.008. For traders following Plancton's approach, a potentially favorable trading opportunity arises if the price is able to successfully break out above this $0.008 area.
Plancton's rules emphasize the importance of waiting for a confirmed breakout before considering a long position. A breakout above the $0.008 level would signify a potential shift in market sentiment and could lead to a bullish trend. However, it's essential to approach this scenario with careful consideration and adherence to trading principles.
In order to execute a trade in alignment with Plancton's rules, traders should:
Confirmation: Ensure that the breakout above $0.008 is confirmed by monitoring price action over a sustained period. Confirmation involves observing whether the price maintains its position above the breakout level and whether there is significant volume supporting the move.
Risk Management: Implement effective risk management strategies, including setting stop-loss orders and considering position sizing. This is essential to mitigate potential losses in case the market movement doesn't align with expectations.
Technical Indicators: Employ relevant technical indicators that can provide additional insights into the strength of the breakout. Consider indicators like moving averages, volume analysis, and trend confirmation tools.
Market Context: Consider the broader market context and news that could influence the price movement of AMBUSDT. External factors can impact the success of breakouts, so it's important to be aware of any relevant news developments.
Patience: Patience is key. Wait for all necessary confirmations and ensure that the breakout is not a false signal before initiating any trades.
It's important to emphasize that trading carries inherent risks, and while Plancton's rules provide a structured approach, there are no guarantees of success. Proper due diligence, continuous learning, and disciplined execution are fundamental to successful trading.
–––––
Follow the Shrimp 🦐
Keep in mind.
🟣 Purple structure -> Monthly structure.
🔴 Red structure -> Weekly structure.
🔵 Blue structure -> Daily structure.
🟡 Yellow structure -> 4h structure.
⚫️ Black structure -> <= 1h structure.
Follow the Shrimp 🦐
