BNO - Wave 3 of 3 = Big Upside PotentialBNO appears poised to break out to the upside. A breakthrough of the recent high just under 33.50 may indicate the beginning of a wave 3. Also appears to be wave 3 of a higher degree. The fibs show significant profit potential. I am placing a buy stop at 33.50.
Key stats
About United States Brent Oil Fund, LP ETV
Home page
Inception date
Jun 2, 2010
Structure
Commodities Pool
Replication method
Synthetic
Distribution tax treatment
No distributions
Income tax type
60/40
Max ST capital gains rate
27.84%
Max LT capital gains rate
27.84%
Primary advisor
United States Commodity Funds LLC
Distributor
ALPS Distributors, Inc.
BNO provides exposure to Brent crude oil, as an alternative to a West Texas Intermediate (WTI) benchmark. BNO exclusively trades front-month futures contracts traded on the ICE Futures Exchange (ICE Futures). The funds exposure is focused on short-term futures thus, it is extremely sensitive to changes in the spot market, as you'd expect, and it can look very different from the returns you'd see in the WTI market. BNO is structured as a commodities pool, so cap gains are taxed at a blended 60% long-term/ 40% short-term rate regardless of the holding period, and investors receive a K-1 at tax time. Overall, BNO is a decent alternative to the WTI benchmark.
Related funds
Classification
What's in the fund
Exposure type
Cash
Futures
Bonds, Cash & Other100.00%
Cash50.36%
Futures49.64%
Top 10 holdings

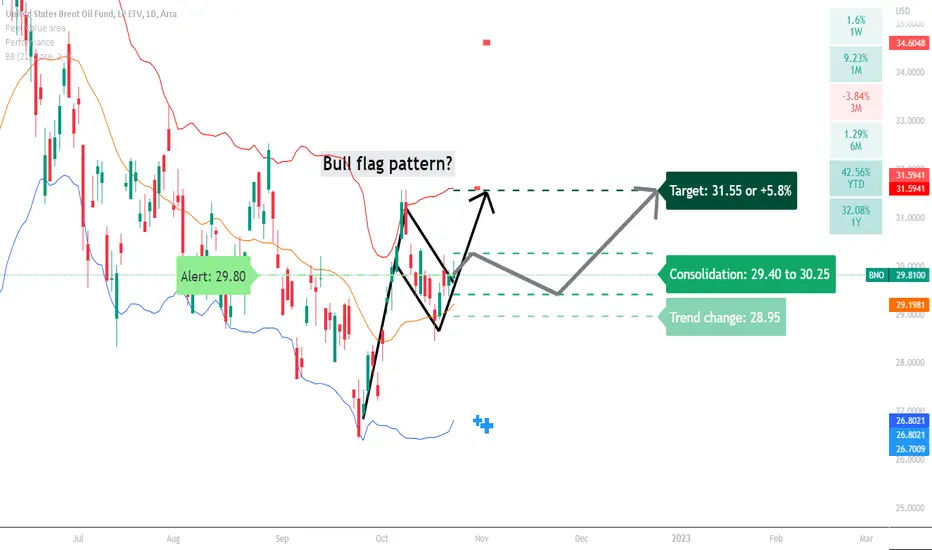
BNO: bull flag pattern?Might the price action start to break up out of the bull flag pattern?
A price action above 28.95 supports a bullish trend direction.
Crossing below this level will negate the bullish trend.
Consolidation price range between 29.40 to 30.25.
Crossing above 30.25 might target 31.55.
Crossing below 29.
BNO , LONG , 2nd attemptArguably I missed an entry on the 2nd for this after getting stopped but it was actually intentionally done as I felt to uncertain as to the effect that the Fed rate change would have on this and wanted more evidence . Now I have it and I think it is a reasonable time to try again here .
I decided

BNO , LONGLong on BNO yesterday .
Range contraction looks good , volume contraction and that pop , consecutive green bars ...
Entry - 30.75
Stop - 29.7
PT - 32.85
* Entered just before yesterdays close . Additional Risk is the FOMC meeting coming up next week , that will probably bring volatility to the mar

BNO short- oil overbought, again.Purchased April 14th $35 puts today. Looking for a pullback to $26 or lower.

Option oil trade.Option oil trade for the next month. We're currently in this trend line. Personally, I'm looking for an exit at around $30 in the next month.


High Octane Hello All,
I am watching the price of oil. Tensions around the world should rewrite & fight the long terms trends here.
I like a buy and hold here. Undervalued and the daily movements look strong.
Price is what you pay,

See all ideas
Summarizing what the indicators are suggesting.
Oscillators
Neutral
SellBuy
Strong sellStrong buy
Strong sellSellNeutralBuyStrong buy
Oscillators
Neutral
SellBuy
Strong sellStrong buy
Strong sellSellNeutralBuyStrong buy
Summary
Neutral
SellBuy
Strong sellStrong buy
Strong sellSellNeutralBuyStrong buy
Summary
Neutral
SellBuy
Strong sellStrong buy
Strong sellSellNeutralBuyStrong buy
Summary
Neutral
SellBuy
Strong sellStrong buy
Strong sellSellNeutralBuyStrong buy
Moving Averages
Neutral
SellBuy
Strong sellStrong buy
Strong sellSellNeutralBuyStrong buy
Moving Averages
Neutral
SellBuy
Strong sellStrong buy
Strong sellSellNeutralBuyStrong buy
Displays a symbol's price movements over previous years to identify recurring trends.
Frequently Asked Questions
An exchange-traded fund (ETF) is a collection of assets (stocks, bonds, commodities, etc.) that track an underlying index and can be bought on an exchange like individual stocks.
BNO trades at 30.47 USD today, its price has risen 0.03% in the past 24 hours. Track more dynamics on BNO price chart.
BNO net asset value is 30.16 today — it's risen 4.08% over the past month. NAV represents the total value of the fund's assets less liabilities and serves as a gauge of the fund's performance.
BNO assets under management is 110.95 M USD. AUM is an important metric as it reflects the fund's size and can serve as a gauge of how successful the fund is in attracting investors, which, in its turn, can influence decision-making.
BNO price has fallen by −8.98% over the last month, and its yearly performance shows a −1.61% decrease. See more dynamics on BNO price chart.
NAV returns, another gauge of an ETF dynamics, showed a 9.34% increase in three-month performance and has decreased by −3.66% in a year.
NAV returns, another gauge of an ETF dynamics, showed a 9.34% increase in three-month performance and has decreased by −3.66% in a year.
BNO fund flows account for −13.55 M USD (1 year). Many traders use this metric to get insight into investors' sentiment and evaluate whether it's time to buy or sell the fund.
Since ETFs work like an individual stock, they can be bought and sold on exchanges (e.g. NASDAQ, NYSE, EURONEXT). As it happens with stocks, you need to select a brokerage to access trading. Explore our list of available brokers to find the one to help execute your strategies. Don't forget to do your research before getting to trading. Explore ETFs metrics in our ETF screener to find a reliable opportunity.
BNO invests in cash. See more details in our Analysis section.
BNO expense ratio is 1.00%. It's an important metric for helping traders understand the fund's operating costs relative to assets and how expensive it would be to hold the fund.
No, BNO isn't leveraged, meaning it doesn't use borrowings or financial derivatives to magnify the performance of the underlying assets or index it follows.
In some ways, ETFs are safe investments, but in a broader sense, they're not safer than any other asset, so it's crucial to analyze a fund before investing. But if your research gives a vague answer, you can always refer to technical analysis.
Today, BNO technical analysis shows the strong buy rating and its 1-week rating is buy. Since market conditions are prone to changes, it's worth looking a bit further into the future — according to the 1-month rating BNO shows the buy signal. See more of BNO technicals for a more comprehensive analysis.
Today, BNO technical analysis shows the strong buy rating and its 1-week rating is buy. Since market conditions are prone to changes, it's worth looking a bit further into the future — according to the 1-month rating BNO shows the buy signal. See more of BNO technicals for a more comprehensive analysis.
No, BNO doesn't pay dividends to its holders.
BNO trades at a premium (0.22%).
Premium/discount to NAV expresses the difference between the ETF’s price and its NAV value. A positive percentage indicates a premium, meaning the ETF trades at a higher price than the calculated NAV. Conversely, a negative percentage indicates a discount, suggesting the ETF trades at a lower price than NAV.
Premium/discount to NAV expresses the difference between the ETF’s price and its NAV value. A positive percentage indicates a premium, meaning the ETF trades at a higher price than the calculated NAV. Conversely, a negative percentage indicates a discount, suggesting the ETF trades at a lower price than NAV.
BNO shares are issued by The Marygold Cos, Inc.
BNO follows the Front Month Brent Crude Oil. ETFs usually track some benchmark seeking to replicate its performance and guide asset selection and objectives.
The fund started trading on Jun 2, 2010.
The fund's management style is passive, meaning it's aiming to replicate the performance of the underlying index by holding assets in the same proportions as the index. The goal is to match the index's returns.