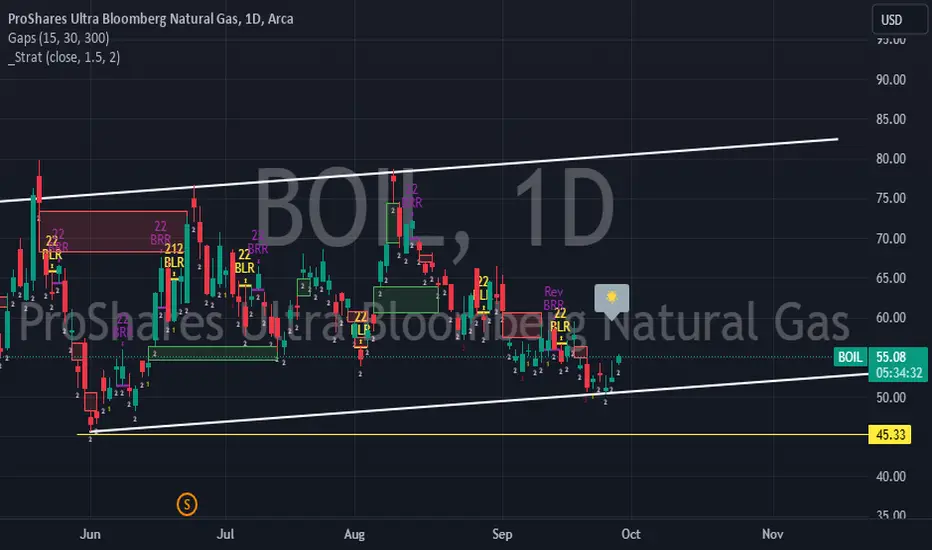
boil is strong bullish boil bullish scenario
boil is good
but i expect to retest key price ( near $65 ) may or not happen
base on fib
BOIL trade ideas

BOIL from $8.86 to $10MODs have suggested that I provide more detail about the picks I make.
Sorry. I'm not as verbose as y'all, and I don't like things to be complicated.
My trading plan is very simple.
I buy or sell at top & bottom of parallel channels.
I confirm when price hits Fibonacci levels.
Bonus if a TTM Squeeze in in play.
I hold until target is reached or end of year, when I can book a loss.
So...
Here's why I'm picking this symbol to do the thing.
Price at bottom of channel (period 52 39 & 26)
Stochastic Momentum Index (SMI) at oversold level
VBSM is negative
Impulse MACD is flat crossing over to the downside
Price at near Fibonacci level
In at $8.86
Target is $10 or channel top
Stop loss is $8.63

Bloomberg Natural Gas (BOIL)Asset Class: Indices
Income Type: Daily
Symbol: BOIL
Trade Type: Long
Trends:
Short Term: Up
Long Term: UP
Trade idea:
-Price rejection from a major Daily demand zone, forming an upward channel.
-Waited for a demand zone to form on a lower time frame (30m) .
-TP set at the SZs with a 7:1 RRR
-Consider trailing your SL or place different orders for each target.
-Apply proper risk management. max position size is 1% of your capital.
Set-Up Parameters:
Entry: 8.92
Stop: 8.53
TP 11.67 (7:1)
!!Be aware of pending Economic Reports. If price is within 20 pips of proximal value at time of major impact report, then Confirmation entry.
Trade management:
**When price hits 1:1 or T1, consider moving stop to entry in case of pullback for a risk free trade.
**Disclaimer**:
The trading strategies, ideas, and information shared are for educational and informational purposes only. They do not constitute financial advice or a recommendation to buy or sell any securities, currencies, or financial instruments. You should do your own research or consult with a licensed financial advisor before making any trading decisions. The author assumes no responsibility for any losses incurred from following these trading ideas.

BOIL breaking Resistance is $12.83 nextHere's a quick analysis of the BOIL (ProShares Ultra Bloomberg Natural Gas) chart:
1. **Current Price Movement**: BOIL has shown some volatility, with recent fluctuations indicating a potential consolidation phase.
2. **Support and Resistance Levels**:
- **Support**: The immediate support level is around $10.50, which has been tested multiple times recently.
- **Resistance**: The key resistance level to watch is around $11.50. We are breaking above this level today and holding it could signal a bullish trend.
3. **Technical Indicators**:
- **Moving Averages**: The 50-day moving average is currently below the 200-day moving average, indicating a bearish trend. However, if the price crosses above these moving averages, it could signal a reversal.
- **Relative Strength Index (RSI)**: The RSI is hovering around 45, suggesting that the stock is neither overbought nor oversold. A move above 50 could indicate increasing bullish momentum.
4. **Volume Analysis**: There has been a noticeable increase in trading volume during recent upswings, which is a positive sign. Sustained high volume on upward movements can confirm a breakout.
5. **Potential Catalysts**: Keep an eye on natural gas market trends and any geopolitical events that could impact energy prices. Positive developments in these areas could drive BOIL higher.
Overall, BOIL is at a critical juncture. If we continue to break the $11.50 resistance level with strong volume it could pave the way for further gains. Conversely, a drop below the $10.50 support level might lead to further declines.

Swing Trading Strategies Part 1: Trend ContinuationIn this two-part series, we’ll explore straightforward yet effective swing trading strategies. Part 1 focuses on a classic trend continuation strategy designed to capitalise on established market trends.
Understanding the Trend Continuation Strategy
The trend continuation strategy is built on the principle of trading in the direction of the prevailing trend. The strategy looks to capture one swing of price action that occurs following a breakout in the direction of the prevailing trend.
Whilst the strategy is likely to struggle during choppy sideways markets, the risk management and trade management components are designed to try and keep losses small during adverse conditions, while letting trades run during optimal trending conditions.
Here’s how you can implement this strategy:
Key Components of the Strategy
Entry Criteria:
• 50MA Must Be Moving Above 200MA
The first criterion for this strategy is that the 50-day moving average (MA) must be above the 200-day moving average. This indicates an established uptrend and serves as a foundational signal that the market has bullish momentum.
Past performance is not a reliable indicator of future results
• Contracting Range Has Formed
Look for a contracting range, which typically appears as a series of price movements that become progressively narrower. This pattern suggests consolidation and a potential imminent breakout in the direction of the trend.
Past performance is not a reliable indicator of future results
• Break and Close Above Contracting Range
A break and close above the contracting range is a sufficient entry trigger.
Past performance is not a reliable indicator of future results
Risk Management:
• Initial Stop Below Range
An initial stop loss is placed just below the lower boundary of the contracting range. This serves to define your risk by protecting your position in case the market moves against you.
Past performance is not a reliable indicator of future results
Trade Management:
Trailing Stop at 9EMA
Once the trade is active, use the 9-day exponential moving average (EMA) as a trailing stop. This allows you to lock in profits while giving the trade enough room to continue moving in your favour.
Past performance is not a reliable indicator of future results
Step-by-Step Guide to Executing the Strategy
1. Identify the Trend: Begin by ensuring that the 50MA is above the 200MA on your chart. This confirms that the market is in an upward trend and sets the stage for the rest of the strategy.
2. Spot the Contracting Range: Look for periods where the price forms a contracting range. This can be visualised as a series of highs and lows that are getting closer together. This pattern often precedes a significant price move.
3. Enter the Trade: Enter the trade when the price breaks out of the contracting range in the direction of the trend (i.e., upwards in this case). Ensure that the breakout is accompanied by increased volume, which indicates stronger momentum.
4. Set Your Stop Loss: Place your stop loss just below the lower boundary of the contracting range. This helps to protect your position from unexpected market reversals.
5. Implement the Trailing Stop: Once the trade moves in your favour, use the 9EMA as a trailing stop. Adjust the stop level as the 9EMA moves up, allowing you to lock in profits while giving the trade room to grow.
Example: Gold
In the example below, we can see that the gold market this year has formed several entry opportunities using this swing trading strategy. With the 50MA comfortably above the 200MA all year, prices have compressed within contracting ranges on multiple occasions. While not every breakout from compression works, the overall trend direction guided by the 50MA and 200MA crossover has provided a strong framework for identifying potential trades. By placing stops just below the lower boundary of these contracting ranges and using the 9EMA as a trailing stop, traders could have captured several upward swings.
Gold (XAU/USD) Daily Candle Chart
Past performance is not a reliable indicator of future results
Limitations of the Strategy
While effective in trending markets, this trend continuation strategy has notable limitations. It relies on clear trends, which may not always be present, leading to false signals in choppy or sideways markets. The use of moving averages like the 50MA and 200MA introduces lag, meaning traders might miss early parts of the trend. Contracting ranges can sometimes result in false breakouts, causing premature trade entries or exits. Additionally, trailing stops with the 9EMA might stop out positions during minor retracements in a strong trend. Finally, like any strategy, the trend continuation method requires discipline and consistent application to be effective, and it may not suit all trading styles or risk tolerances.
Conclusion
The trend continuation strategy leverages moving averages and price patterns to identify and capitalise on strong market trends. By focusing on a contracting range within a bullish trend, and using a trailing stop to manage risk, this strategy offers a disciplined approach to swing trading.
In the next part of our series, we’ll explore another straightforward yet effective swing trading strategy.
Disclaimer: This is for information and learning purposes only. The information provided does not constitute investment advice nor take into account the individual financial circumstances or objectives of any investor. Any information that may be provided relating to past performance is not a reliable indicator of future results or performance. Social media channels are not relevant for UK residents.
Spread bets and CFDs are complex instruments and come with a high risk of losing money rapidly due to leverage. 83.51% of retail investor accounts lose money when trading spread bets and CFDs with this provider. You should consider whether you understand how spread bets and CFDs work and whether you can afford to take the high risk of losing your money.

BOIL in strong downtrendBOIL is in a strong downtrend.
The daily chart has hit a new low
But the 1-hour chart has now become "extended"
Remember there are 5 waves in an average trend. Once the trend becomes extended, the price likes to break above the 50 SMA to "recalculate" and continue or "recalculate" and reverse.
We love both right? The question becomes, which direction will the market choose?
No one knows. So all you can do is trade your strategy off of the current patterns and information that you see.
That's why 'risk management" is so important. Use 1% of your current total account value on each trade.
That's formula I use in my trade plan and it has served me well.
Link in profile :)
That's all you can do.

BOIL trends up continuation expected LONGBOIL is here on a 30 minute chart. It has reversed this week and ascended 13% with a double
bottom at 13 and 13.25 forming a resing support trendline. Volumes changed from selling
to buying. Price bounced off the ATR- stop loss in its pullback and now appears poised to
break through the moving average channel and get support after that cross-over.
I will take a long trade here with a stop loss of the pivot low of 14 while targeting the
upper boundary of the Keltner channel at 15.25 for two-thirds the position with the remainder
to run to try to reach 37 , the pivot high of January. As a leveraged instrument, BOIL is very
volatile and needs extra care in the trade.

BOIL is about to make a big move this springThis stock is deeply oversold on the daily, weekly and monthly charts.
As you can see, it's about to squeeze out of this long downtrend.
We all know BOIL is not a long-term hold because of its futures rolling decay; but this year it could be a huge winner with Natural Gas near it's all-time lows and also deeply oversold.

BOIL: Set for a Potential Bullish Reversal at Bullish Shark PCZNatural Gas on an intra-week basis seems to be in a position to Bullishly Reverse as it sits at the PCZ of a potential Bullish Shark with slight Bullish Divergence near the previous month's low. My target will be anywhere between $16 and $20 though it could always go higher.

BOIL- Premarket Long Trade Scalp RecapsBOIL is here on the 15- minute chart with a set of Bollinger Bands, a Bollinger Band Oscillator by
LuxAlgo as well as a dual-time frame RSI indicator by Chris Moody. The settings for the Bollinger
Band set up are period 49 EMA 14 standard deviations 2 /2.618 ( These are multiples of 7 and
Fib #s for mathematical reasons.
Entries are signal is price crossing the base line of the Bollinger Bands ( the EMA 14) or else
the RSI lines crossing over the 50 level and green above red.
Exits are the price action going outside the outer upper BB band and then fading back inside
of both inner and outer bands or RSI green and red crossing such that green fades quicker than
red. Entries and exits are managed with alerts/notifications to minimize screen time.
The first trade began on 2/27 at 8:10 AM ended 2hours later. 50 shares taken gained $ 1.50 each
for a total of $75.00 realized profit in the long scalp. The second trade on 2/28 was
taken in the premarket at 6:45 AM EST with again 50 shares taken then closed at 9:15 AM
for a 150 minute trade. Realized profit was $1.20 per share and $60 overall.
Overall, there were 4.5 hours in the trades yielding $135.00 or $30 hr for the time in the trade.
Risk was minimal as trades were taken at the lows with a stop loss outside the BB and below
them. Time spent on the screen amounted to less than 30 minutes overall making the
realized profit excellent for the time and effort expended. This idea illustrates good use
of a Bollinger Band strategy coupled with alerts and notifications. Notably, I did not spend
any effor adjusting the stop losses during the trade as I am very confident of the setup and
the strategy. Today is another day for the same trade.

BOIL 3X / Triple Leveraged Natural Gas ETFon the 4H chart is showing a round bottom reversal at the bottom of the high voume area
and rose over the POC line of the intermediate-term voume profile. Price now has room for
a 50% move to the top of the high volume area at $ 52. The chart shows the relative
volume indicator supports a long buy as does the dual time frame RSI.
A speculative call option trade would be $60 in 4 months while a safer call option
would be in the money @ $30 in 7-9 weeks. I am also looking at UNG, LNG and XNGUSD on
forex.

BOIL is starting to get hot ( 3X Natural Gas ETF)as shown on the 15 minute chart is rising in an ascending parallel channel and is suitable
for a long buy entry when the indicators are triggered. The onslaught of winter cold, the
sanctions against Russian gas exports and inflationary pressure on commodities all bode well
for the trend up for natural gas on forex and equities markets. See also my idea linked below
for a view of the chart from the 4H time frame.

BOIL ( Natural Gas Futures 3X leveraged) heats up LONGBOIL in the past month fell from a head and shoulders pattern on the 15 minute time frame
into a trend down which leveled out into a double bottom. Supply is in a draw
down right now as might be expected when gas production is diminished in the middle of winter
while demand is rising. The Economics 101 expectation is rising prices on the futures market.
The chart shows a Fibonacci retracement would take price from its current level to about 29
or about 20% upside if that level holds and more if prices can make a stronger more or
if short positions or puts are forced to closed causing some buying pressure synergy.
The RSI indicator confirms the reversal at the double bottom and adds a bit of insurance
to the risk. Accordingly, I am expecting a 20% in the next 2-3 weeks. Target for 2/3 of
the position is 29 while the other 1/3 ( short squeeze scenario) to run to a target of 33
which is the neckline of the H & S pattern. Taking a look at OTM call options striking
$ 30-31 range. Additionally, I will watch the AI algo indicator for a Sell Signal and reassess the
position at that time given its 90% accuracy at this given time frame as evidenced by
a 2000 candle backtest ( or about 500 hours or 82 trading days). Energy may not be the hottest
sector right now but nor is it the coldest.

BOIL reverses from a quick downtrend LONGBOIL on may 9th went into hard resistance in the highest VWAP line area, the Hull moving
averages did a death cross and it fell 12% into the support of the first upper standard
deviation line where it double bottomed with a reversal. The ZL MACD shows lines and
trends that are confirmatory. As a result, I have closed my short trade from my prior
idea and revested the capital gained into a long position of stock and calls. If you
are interested in knowing targets or stop losses, please leave a comment.


BOIL Reversal point?I see this more as an exciting reverse the trend entry. Entering with small volume and adding more if the trend decides to go upwards from here.
As the world is trying to go green Natural Gas is the less polluting source of energy.

BOIL .. Time to put this back on the stove ??Boil.. after several false starts, I think we are close for a reversal on BOIL, primarily as NatGas gets a bid.
(Colder weather please)
This tradeable is very volatile so be careful.
In other words you date this... not marry it !
Have a tight stop and game plan.
Do your own due diligence.
Good Luck
S.

ProShares Bloomberg Nat Gas ETF (Boil) ... Near term Reversal ??Not often you get two harmonic indicators flashing (Bullish Butterflies) ... one on the share price and one on the RSI. (A confluence has to work worked the past.)
Certainly worth watching... for a reversal in the area marked.
Shorts may consider covering....
I'll chirp in if this reversal becomes more certain.
For now I'm interested but neutral
DYOD. Not Investment advice.
S.

BOIL: Spring and Backtest with Hidden Bullish Divergence BOIL is preparing to shift out of the range as it Bullishly Diverges on the MACD during its spring and backtest and shifts out of the lower RSI Extremes.
We may just get a move to $90 and call it there, but I do think it's possible to see the $150s if this setup truly does result in the absolute bottom.

$BOIL Bounce from bottom of the channelNot Financial Advice.
AMEX:BOIL
3rd day on the green trying to bounce from the bottom of uptrend channel. Be cautious!!
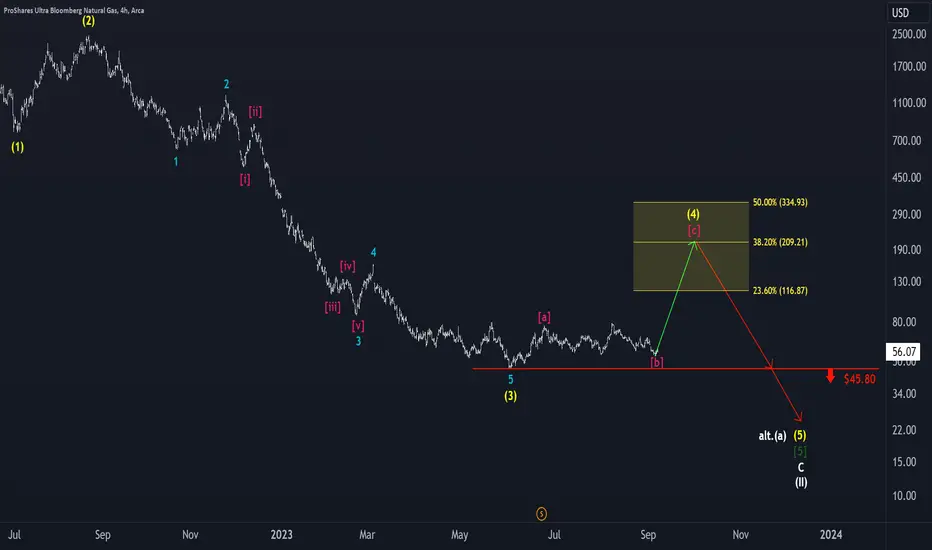
BOIL: One more climb to go 🏔️BOIL's price has successfully wrapped up the magenta wave (b). Looking ahead, we foresee an ascent in the fourth leg of the yellow five-part wave, targeting the yellow Target Zone between $116.87 and $334.93. Following this ascent, a substantial decline is expected, bringing the price down to around $23, signaling the conclusion of the white wave (II). This yellow Target Zone presents an opportune moment for initiating short positions to capitalize on the anticipated bearish movement.
NATURAL GAS JUST FARTEDBroke down. Got out a while back at top of channel, but looking to buy back in if RSI goes
down to 25 to 30 oversold conditions for short term trade. Morgan just upgraded global energy,
but, XLE just printed the mother of all gravestones. Most this year I've noticed more
of a divergence between natty vs crude (not sure about this) - gonna be really patient
with this trade if it happens. What y'all think?
GLTA

BOIL rises into reversal territory SHORTBOIL as a triple leveraged ETF of natural gas futures- has high volatility
which can translated to high profits for traders who can accurately harness
that energy .On the 2H chart in the time since the reverse split, the price has mostly
ranged up and down between the first upper and lower VWAP lines of the
VWAP anchored to the high in May. Occasionally it has ranged outside those bounds
and then reverts to the mean VWAP. Price is presently at or near the first upper
derivation line where it typically pivots down. The zero lag MACD is suggestive
of an impending pivot down before any signs of it and thus showing bearish divergence.
The mass index is not yet suggesting a reversal. The shorter HMA 56 rising significantly
above the HMA210 is suggestive of overextension into the overbought overvalued
zones of the chart.
Overall, I will put BOIL on watch.
Once a reversal is confirmed I will either short BOIL or long KOLD. Leveraged funds being
what they are and mathematics fixed and hard, shorting a levearged ETF is a faster fall
than its rise so the short position will be my first choice.
