BOIL (3X Natural Gas ) Overnight Trade RecapAs a triple leveraged ETF BOIL is highly volatility and typically has a good range
even if the overall price changes only a small amount from one day to the next.
While these overnight day trades are typically conducted on the 3 or 5 minute time
frame, here a 15- minute chart is shown. Because BOIL is tracking natural gas
futures and the futures markets are around the clock , BOIL often has movement
after-hours and in the pre-market while futures markets are active.
In this example, the chart is dressed with double Bollinger band setup with
deviations of 1.618 and 2 618 which are Fibonacci numbers. Relative volatility
and relative volumes are indicated as well to be better attentive to reversals
or trending amplitudes.
In this example at about 12N on yesterday 7/24, price dropped out of the bands
volume and volatility went red to green and the candlesticks formed a morning
star pattern. This is the entry. The stop loss is placed just below the lowest bottoming
wick in the pattern. Today, in the premarket, when the price rose to outside the upper
trade zone and green bars on the volatility and volume indicators fell quickly, the
trade was closed for a realized profit of 4.7%. About 90 minutes later, another
long trade was set up for a more than 4% five hour day trade.
Rinse and repeat DYODD !
BOIL trade ideas

BOIL ( 3x Nat Gas ETF) Reverses to UpsideOn shown on the 15 minute chart with a VWAP band/line setup anchored to the July 1st
pivot high. BOIL is in a VWAP breakout since bottoming mid-day July 17th. Confirming
the reversal are the Price Volume Trend Oscillator printing a green histogram and an
upgoing signal line as well as the zero-lag MACD with upgoing parallel lines crossing
the zero-horizontal line. Price has crossed over the mean VWAP. On the dual time frame
RSI indicator both the lower and higher RS lines ( blue and black) are above the 50 level
and the lower time frame is higher highlighting bullish momentum.
I will take a long trade targeting based on the VWAP lines first $65 and then $68. I will open
equal amounts of call options striking the targets with expirations on July 28th. I seek a
100% ROI in the next 6-8 trading days. On an intraday basis, I may enter a low DTE call option
at the low of day ( typically mid-morning) and exit at the high of day the same or next day.

BOIL- Go Long SetupBOIL has had a busy month with the resurgence of natural gas prices and the reverse
split six trading days ago. I analyze it as having further upside. On the 30-minute chart
I have added two anchored VWAPs to the left on separate pivot points. This serves
to make out dynamic support and resistance. Price has crossed over the mean VWAP zone
which is between the heavy black lines. In confluence with that, it has crossed over the
POC line of the volume profile represents the price point with the highest total trading volume
over the visible time interval. Above price are the two targets being one and two standard
deviations above the mean aVWAP. The volume indicator shows increasing relative volume
overall as a sign of accumulation which generally results in price appreciation from
the demand trend. I will set the stop loss at $.10 below the POC line and take a long
position. One third of the position will come off upon each target advancing the stop loss to
above the entry and making the trade risk-free. Another third with TP2 and finally the
The remaining third will run on a trailing stop so I do not spend time micromanaging a smaller
position. I believe that my overall bullish bias will be rewarded yet again over the near term.

Symmetrical TriangleNG is having a tough time as of late.
KOLD is it's opposite (bearish NG) Boil is bullish NG.
Both are leveraged.
Triangles are neutral until broken.
No recommendation.
BOIL - bullish based on pitchfork analysisBOIL price fell 98% but the technicals (particularly analysis of pitchfork lines) indicate that BOIL is a good buy opportunity.

BOIL Day Trade Recap and ReviewBOIL the 3x Leveraged ETF of natural gas futures has been highly volatile. Volatility yields high
profits if there are good entries and trade management. This past Friday BOIL was doing a
reverse split ( 20 shares become one) which I considered to be an opportunity for high profit
because a higher number of traders would have eyes on the chart.
The 15-minute chart is shown here with an anchored VWAP from 2 days earlier. At market open
price reversed a downtrend after the reverse split in the premarket. It got support from the line
one standard deviation below the mean VWAP. My first considered entry was the second green
HA candle in the reversal with a stop loss at the pivot low of the red candles. However
I passed on this entry and instead entered upon price crossing the mean VWAP. The entry
was supported by the indicators showing Z score and volatility. The entry was made more
precise by analysis on the 5-minute chart. The stop loss was set at the value of the close of the
last candle to close below VWAP. After that, trade management was routine. Every time
price went up 1% I raised the stop loss by the same amount until getting up 6% Once at that
level, I changed to a trailing stop loss of 2% so I could pay attention to other trading chores.
At the same time, I set an alert for when the price crossed to above two standard deviations
above the mean anchored VWAP. I did this because this is the overvalued overbought area
where institutional traders will set sell orders either short selling or closing profitable
trades. The resultant reversal would diminish my unrealized profits. In this case, I got
the alert and closed the position without the trailing loss. The trade resulted in a profit
of 12% without use of leverage or margin other than the leverage imbedded in BOIL inself.

BOIL / KOLD - a leveraged natural gas oscillatorHere on a dialy chart I have plotted the ratio of BOIL share price to that of KOLD, its leveraged
inverse. They both react to and reflect natural gas prices which are currently rising. I have also
plotted the supply demand indicator from Luxalgo and a better RSI indicator. As can be seen
on the chart the ratio ascended from relative weakness last fall into a long head and shoulder
pattern and then descended into its present range. The RSI bottomed abot 5/4/23 and
increasing since then. I see the present pattern as similar to what occurred last fall.
My thesis is that I should buy BOIL now as its price ascends until the ratio hits the supply
zone above and then flip by selling and buying KOLD instead. I see this as essentially a natural
gas buy and sell oscillator. To have more frequent trades and higher overall profits,
I would need to decrease the timeframe for the analysis down to 1-3 hours and follow
the ratio trending accordingly. At present, I will continue to accumulate further long positions
in BOIL

BOIL a scalp trade LONGBOIL had trended down from a high about May 19 until June 2nd when it reversed and gained
for one week before resuming its trend down. This can be seen on the half hour chart. The
The attached RS indicator shows the decreasing strength trending down from 65 to 40 over the
past few trading days. Upon drawing trendline support and resistance. I note that a descending
or falling wedge pattern is evident. This is a bullish chart pattern predictive of a price action
reversal. A volume profile is added to the chart showing the highest volume of trading at
the POC line corresponding to a price of $2.58.
I will trade a long trade on BOIL by way of a buy stop at $ 2.59 with a stop loss at $2.57.
The target will be the top of the high volume area of the volume profile @ $2.74.
This trade will risk $0.02 compared with a potential profit of $ 0.15 yielding a reward to
risk of 7.5. As it turns out, I did this exact same trade this past Wednesday June 7rh.
Besides 100 shares I will buy one call option striking $2.50 with an expiration of 6/30
to leverage the trade.

BOIL Natural Gas Price Recover and ReverseBOIL on the 2H chart has bottomed and begun the reversal as this leveraged natural gas fund
sees a red to green in the HA candles as well as the volume. Price has crossedover the POC line
of the long-term volume profile and exploded from a Doji candle below the mean anchored
VWAP with consecutive engulfing bullish candles.
The Luxalgo AI predictive indicator suggests a parabolic move higher and
a correction in the first part of next week. I have already profited 700% on this trade that I
have been in since my earlier idea on BOIL. I will add to the position now but be watchful
for a reversal of the reversal while watching a volatility indicator to set the exit.

Natural Gas - Set to Fly High with the Dollar?Weekly Long Position on AMEX:BOIL
A new major low was observed in this market on May 30th
The security of interest is $NYMEX:NG1!. Using a leveraged product AMEX:BOIL to gain exposure to a potential short-term movement, as a continuation of a long-term trend. See below the chart of $NYMEX:NG1!.
Commodities, equities, and other assets priced in US Dollars are subject to relative foreign-exchange changes, as realisation of risk is highly complex in globalised markets. The price of NYMEX:NG1! represents some relationship to an almost infinite supply of financial products, as capital moves around the interconnected world.
For example, Iran is not apart of SWIFT and must exchange assets to engage in trade with other nations. Their crude oil is paid for in gold. However the 'zero-risk' benchmark for both these commodity products, NYMEX:CL1! and COMEX:GC1! , are priced in US Dollars. As the relative strength of the US Dollar fluctuates, asset prices too will fluctuate even without alteration to any of the fundamental dynamics of the market in question. Martin Armstrong has established himself the foremost expert on 'Capital Flow Analysis'.
See below the chart of COMEX:GC1! , FX:USDCHF , ECONOMICS:USCPI
Important to note is the lack of direct correlation between Gold priced in US Dollars, and US Dollar domestic inflation (CPI). Contrary to the assertion of many analysts, gold responds directly to sovereign-related risk. The 'relative-value' of gold at the time of each major high reflects price discovery across all asset classes, though we can only view one time-price continuum on a chart.
With that in mind, see below the chart of TVC:DXY and a few commodities.
All these markets demonstrate various correlations to one another, there is a general trend that can be observed. As the capital flows persisting from Feb 2022 onwards reflect a shifting global investment outlook, towards high-quality assets.
Over the course of the last few financial crises, the safe place for capital was US sovereign debt, in the form of Treasuries. As the plumbing of the two-tier global banking system is operated by the US Federal Reserve, highly liquid money markets keep the USD afloat in times of financial stress. However, this has not always been the case. During the Great Depression, the contraction of capital (deflation) was so severe that physical, paper US Dollars were the global asset of choice for security. Capital formation could continue once the price of gold was un-pegged from the dollar, to properly reflect price discovery in the newly minted global economy.
Energy markets have become particularly chaotic over the last 16 months, as Russia plays an important role, particularly in Europe where a network of pipelines has become a security issue. Heavy sanctions have been placed on Russia, as well as an outright ban of a large quantity of its exports. Russia, having control over Ukraine's direct access to the ocean, has returned the favour. Resulting in a disruption in markets from wheat, and lumber, to gold and neon. With the Nordstream projects in critical condition, Europe's energy fragility should be of great concern, both domestically and to its allies.
Among the sanctions, is a 'price cap' on the price of crude oil for export at $60/barrel. See chart of NYMEX light crude, and European brent crude.
For those not aware, these represent relatively "raw" product exchanged on global markets. Crude must be refined to produce products like gasoline, diesel, lubricants, etc. As with any attempt to artificially manipulate the price of an asset, this presents arbitrage opportunity. Since December when this was imposed, China and India have reportedly been buying Russian crude, refining and exporting it.
Russia has spent years purging US Dollar exposure from its energy markets, as war in the Middle East has steadily grown tension between the two powers. Foreign exchange markets are very sensitive to volatility, and can respond unpredictably to major shifts in trend. The consequences of capital moving around the globe quickly can be devastating, see FX_IDC:USDRUB , TVC:US10Y , and TVC:MOVE the US bond market volatility index, compared. All markets must respond to price action, as real risk remains deeply concealed.
All while this is going on, global shipping has become significantly more expensive. Meaning the logistical element of global energy markets has become very convoluted. From cheap oil sitting on tankers, to arbitrage of diesel products, to ships transferring oil between one another to conceal Russian oil, to leveraged oil ETFs, the dynamics of NYMEX:CL1! have become almost unfathomably complicated.
So to return to NYMEX:NG1! , the value of this product lies in simplicity. The current price can only be assumed to properly reflect global monetary conditions, as a dramatic correction can be observed. The art of business, is buying what nobody wants and selling it when everyone wants it. So much focus in finance at the moment is pointed towards the Federal Reserve and its attempted manipulations of the interest rate on US Dollars. Why this is taking place however, is a subject that has avoided capturing attention.
The Federal Reserve is attempting to combat WAR INFLATION by creating deflation domestically, supported by capital flows from abroad. Flight to quality will take place independent of any institutional power, by offering a higher rate of return on Treasuries the Fed is more likely to be able to reduce its balance sheet, and support NATO's war efforts. In order to pay troops, send equipment offshore and make loans to Ukraine, capital must leave the borders of the United States, to the sum of trillions, creating massive inflation globally.
So to clarify, global capital is fleeing towards the United States. However, the only sources of capital formation in the United States are financialization, and war. Stagflation, thought to be impossible, has returned to the world. As such, equity and asset prices can continue to rise, without actually rising in relative value globally, since the same will occur in the sum of tanks, aircraft, etc, moved around the world. A zero-sum game.
The fact of the matter is that the world is going to need natural gas - and a lot of it at that. The current domestic investment climate can't adequately adjust for this, the dominant psychological trends in markets push capital down paths which are facilitated by political means, for example 'Environmentally Safe Governance'. Exploration of gas reserves and extraction of energy products has become very unpopular in the last decade, to the unfortunate dismay of anyone who hopes to drive car or live in a heated home in the next decade.
Of note, that besides the US and Canada the largest producers and exporters of natural gas are apart of, or close to the influence of BRICS. Any global conflict which takes place, will first manifest itself in global financial markets, and there is lengthy historical precedent for this. Europe, which has its gas supplied from abroad is completely exposed to market energy prices, as well as the logistical risk of actually supplying said gas. A precarious position to be in, as war knocks on their door.
Immediately after Russia's invasion of Ukraine, the world saw a vision of the future flicker as gasoline prices skyrocketed. Reality as we know it in the industrialised depends on simple global logistics, and cheap energy prices. Both of these constructs are crumbling very quickly, and cannot be resolved until a settlement is made between Ukraine and Russia. Money printing and sanctions cannot make more natural gas appear, nor get it across the ocean cheaply.
I propose a trade on AMEX:BOIL , to gain exposure to volatility in Natural Gas markets. Lines of support/resistance represent the arbitrary price points I suggest may be relevant, and can be used for entry/exit and position management.

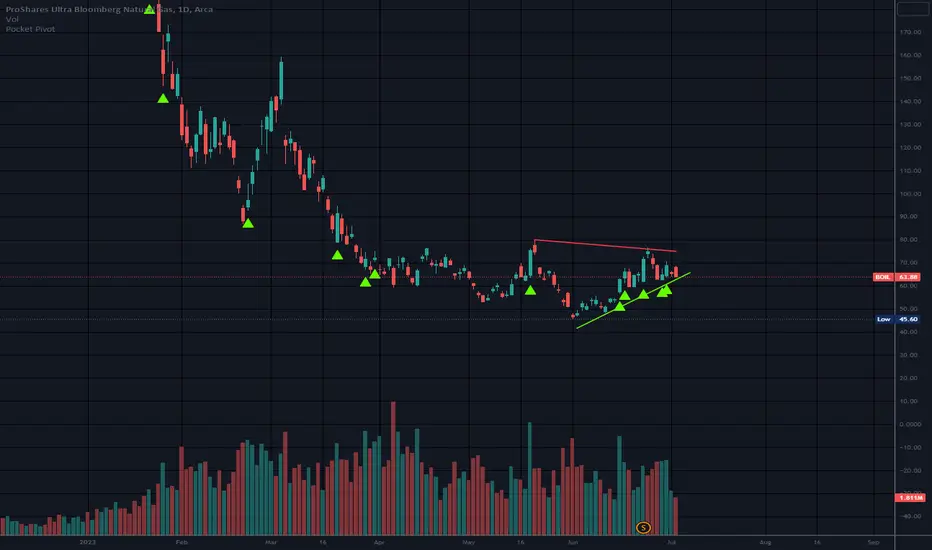
NATGAS BOIL NG Bottoming formation.Natural gas has been basing for a few months now in what has become a very recognizable Wyckoff accumulation pattern. Complete with high volume on the start to low volume towards the end. Breakouts occur on LOW VOLUME in accumulation phases so don't look for volume to give a clue. Just like the AMEX:SPY and NASDAQ:QQQ markets did at the October bottoms. Remember everyone saying how low the volume was? Yes, same here. We also see a very recognizable MEGAPHONE BOTTOM specifically on BOIL. This is regarded as a bullish signal showing that the existing downtrend may reverse to start a new UPTREND. Further, we see evidence in arcs of a possible bottom. EW counts also suggest the bottom is in for now.

BOIL Megaphone PatternBOIL on the 15-minute chart is currently in an upward facing megaphone pattern. I have drawn
in the upper and lower trendlines which are a form of static support and resistance. The
megaphone pattern is one of increasing volatility between buyers and sellers and indecision
It is the opposite of consolidation in a narrow channel. The anchored VWAP
shows BOIL to be between the mean VWAP and the first standard deviation band below it.
This is generally considered the lower part of the fair value zone. The volume profile has a
high volume area of in the price range of 3 to 3.7 while the POC line is confluent with the
VWAP. The "better" RSI oscillator/ indicator shows values above 75 at swing highs
and values below 25 at swing lows. My goal in this trade is to buy at the lower ( support )
trendline and sell at the higher ( resistance) trendline. I will be watchful for any fibonnaci
retracements of a prior trend. At present, BOIL is at that lower trendline and RSI is showing
weakness. I will add to my position now as I did in the whipsaw action some hours ago at the
location of the bearish engulfing candles in the premarket and the opening.

BOIL LONG a 3x leverage Natural Gas ETF Natural Gas prices have finally reversed on the FOREX markets
after significant downtrends from a historical high.
BOIL on the hourly chart has reversed a two-week downtrend
and today has an increasing volume. Ir bounced off the lower
Fibonacci levels and is looking to revert to the mean. Price
was undervalued below the green fair value zone at the VWAP
+/- one standard deviation but is now heading back into it
from the buying pressure.
As a 3x leveraged ETF is prone to more volatility than the
unleveraged UNG counterpart. I will play this with a call
option contract expiring 3/31 striking $4.00 and expecting
at least a 50% return in the upcoming 8 trading days.
The risk here is that this is just a short pullback on the
downtrend but getting in early on a long and watching carefully
is the approach I have taken.

The Hard Boiled BOIL Bulls could catch a breakWho says you can't chart 3X leverage?
Got a nice down channel here and about to hit the bottom of the channel.
4.20 at the end of next week would be a nice price.
That would be over a 96% drop from the top. Interestingly, the previous peaks in Nov 2018 and Feb 2014 dropped just over 96% before touching the channel bottom.
Could overshoot below since it overshot out at the top.
Also could bounce early like that small bounce in Dec 2015, before tanking lower and tapping the channel.
Lots of breakout potential in the RSI.
Feeling like there's going to be some crazy times ahead... if things aren't crazy enough.

BOIL: Boiling up and down 🥘Still a bit tentatively but visibly, ProShares Bloomberg Natural Gas (aka BOIL) is starting to boil up, quite in accordance with our expectations. As the first part of a three-part counter movement, the ETF should climb further upwards to finish wave a in magenta, before wave b in magenta should return it to its current level. From there, BOIL should rise into the yellow zone between $7.11 and $19.05 to complete wave c in magenta as well as wave (4) in yellow, whose high should then initiate the overarching downwards trend’s final step: wave (II) in white.

Long! Divergence under moving averageIndicator divergence under moving average. Good signal
Short AMEX:KOLD to around 40USD or Long AMEX:BOIL for a small profit. When two opposite markets show opposite signals. It is a good one

Does this long-term pattern continue?Boil has followed some interesting arc patterns over the past decade? It seems to be becoming more extreme as it starts to breach the bottom line. It is certainly at a point to pay attention to.

Long natural gas Breakout retest needs to hold the last low
Close above 6 is better
In price 6.04
SL 5.4
TG on the graph
Will hold for a while

BOIL hitting a major line of resistance For the 4th time since 2012 BOIL has hit the bottom of this descending channel. The fib extension landed perfectly on the 1 (3.31) and the stoch RSI (monthly) is showing oversold. A short-term move up to the first and/or second brown line has been the historical bounce, eventually making it to the third brown line before falling again. So lets see if it reacts the same way or if it finally busts below this blue trendline.

Natural Gas and the Dangers of Swing Trading Leveraged ETFsThinking that the war in Ukraine would cause the price of natural gas to surge higher over the winter, many traders got stuck on the wrong side of a trade. Natural gas futures have plunged more than 90% over the winter.
In this video, I explain that regression analysis was warning that a significant price decline was imminent in late 2022, and I explain that it is now suggesting that a bounce in natural gas prices may soon occur. This video also explains the pitfalls that many novice traders experience when trying to swing trading leveraged ETFs that employ derivatives and which undergo volatility drag over time.
Here is the link to the risk-reward / win-ratio spreadsheet that is referenced in the video.
docs.google.com
Shared with permission from @HeWhoMustNotBeNamed
Note for stats nerds: The log-linear regression channel indicator does not give negative numbers for the Pearson correlation coefficient (r). The indicator gives the absolute value of the Pearson correlation coefficient |r|. So if the correlation is strongly negative or strongly positive, it will appear near 1 in both cases.
Important Disclaimer
Nothing in this post should be considered financial advice. Trading and investing always involve risks and one should carefully review all such risks before making a trade or investment decision. Do not buy or sell any security based on anything in this post. Please consult with a financial advisor before making any financial decisions. This post is for educational purposes only.

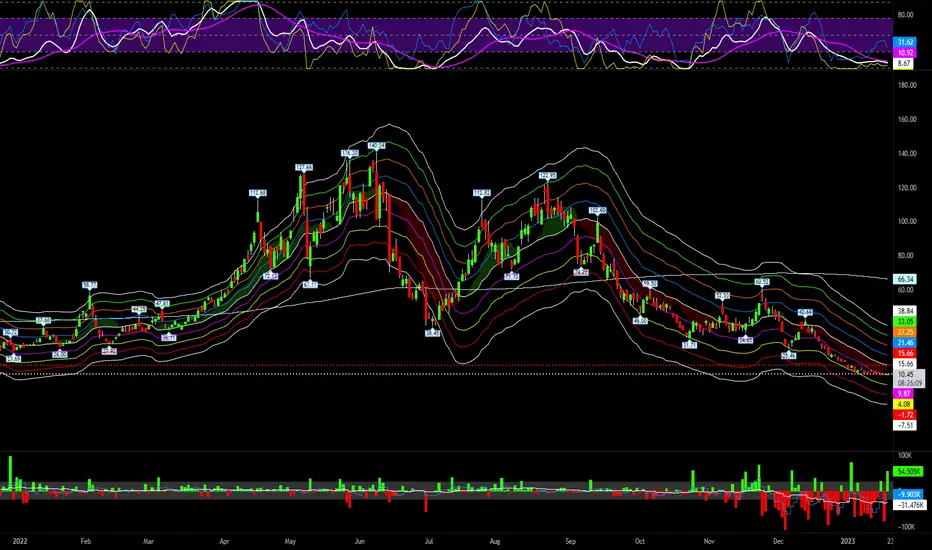
BOIL 2X Leverage Natural Gas ETFBOIL 2X Leverage Natural Gas ETF. Natural gas hit a 52 week low recently. Therefore, from a strictly risk : reward entry setup, this BOIL post is long from $10. Plus, pi RSI is near perfect long entry setup today & BOIL options data is very bullish now. Here's levels on the BOIL 16hr ext chart (1 day):
SMA200 = $66
VWMA 20 TTCATR(beta):
top = $35
R3 = $33
R2 = $27
R1 = $21
pivot = $16
S1 = $10
S2 = $4 (skewed results)
S3 = -$2 (skewed results)
bottom = -$7 (skewed results)
2/17/23 expiry options data:
Put Volume Total 68
Call Volume Total 604
Put/Call Volume Ratio 0.11
Put Open Interest Total 21,203
Call Open Interest Total 43,498
Put/Call Open Interest Ratio 0.49
3/17/23 expiry options data:
Put Volume Total 29
Call Volume Total 404
Put/Call Volume Ratio 0.07
Put Open Interest Total 14,286
Call Open Interest Total 39,351
Put/Call Open Interest Ratio 0.36
BOIL UPDATE LONGTERMOn the daily chart, BOIL price has never been lower and the relative volume has never
been higher in the past five years. Being mindful, this is leveraged it falls faster than an
the unleveraged counterpart of the same commodity ( UNG INL) However moves in the
opposite directions are also amplified. Horizontal red lines are drawn in consideration
of pivots on the 4H. Price was nearly $600 in 2019. Can you think of a fundamental
reason why price cannot rise from the present price to something closer to that
of 2019. To go from $4 to $600 is 150X in otherwords 15000%. Is there anything
wrong with my math or the chart?

bullish cyper on dbl bottom by AD + stoch rsi $21 tagetthere is a bullish cypher showing two targets $21 and $42 area. notice that the stoch rsi and and AD both have double bottom on the weekly chart. this is very bullish
