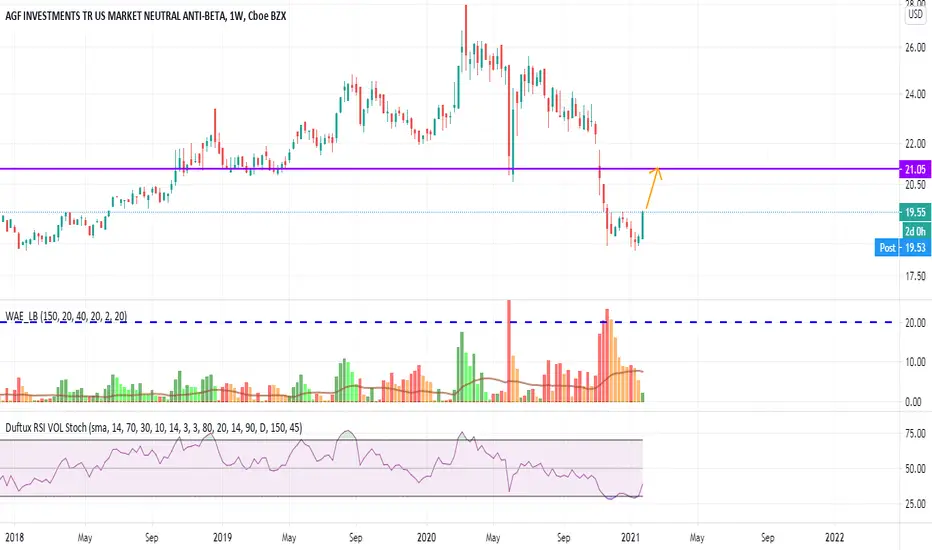
Hedge Fund Exposure vs The market .... Hedge Fund Exposure proxy BTAL etf vs The market as a whole ....
Key stats
About AGF U.S. Market Neutral Anti-Beta Fund
Home page
Inception date
Sep 13, 2011
Structure
Open-Ended Fund
Replication method
Physical
Dividend treatment
Distributes
Distribution tax treatment
Ordinary income
Income tax type
Capital Gains
Max ST capital gains rate
39.60%
Max LT capital gains rate
20.00%
Primary advisor
AGF Investments LLC
Distributor
Foreside Fund Services LLC
BTAL actively manages its portfolio of stocks through a market neutral strategy. The fund targets the top 1,000 by market-cap, including REITs, in the Dow Jones U.S. Index. The fund`s market neutral approach aims to offset nominal long and short positions. BTAL ranks stocks in each sector by beta, and individual stocks get equal weight within their sectors. Overall, long low beta and short high beta might be expected to negatively correlate to equities despite the equal dollar offsetting exposure. While BTAL uses swaps at times, it typically takes direct short positions in stocks rather than relying solely on derivatives for short exposure. Therefore, the fund reports short interest costs in its expense ratio, something that purely swaps-based long-short funds don`t have to do, although short interest expense hits the bottom line in either case. Prior to Feb. 14, 2022, the fund tracked the Dow Jones U.S. Thematic Market Neutral Low Beta Index following the same strategies.
Related funds
Classification
What's in the fund
Exposure type
Finance
Cash
Stocks75.40%
Finance10.13%
Technology Services6.87%
Health Technology3.40%
Consumer Non-Durables3.18%
Electronic Technology2.73%
Consumer Services2.41%
Process Industries2.40%
Utilities2.08%
Transportation1.77%
Industrial Services1.64%
Producer Manufacturing1.26%
Energy Minerals1.17%
Retail Trade1.10%
Health Services0.95%
Distribution Services0.93%
Commercial Services0.90%
Communications0.90%
Consumer Durables0.20%
Bonds, Cash & Other24.60%
Cash95.83%
Miscellaneous−71.22%
Top 10 holdings

How I Became an Anti-Beta GigachadHigh beta stocks are terrible in a recession. This fund has no direct market exposure, but takes an aggressive position against high beta stocks. It will rise in recessionary conditions.

alternatives for the winCheck out BTAL as an option for an alternative allocation for your portfolio. CVSIX if you can access mutual funds, BTAL if you can't. Both are market neutrals. As we top out in the market, alternatives become more and more crucial to protecting your portfolio and furthering the gains.
*This is no

use BTAL as a form of protection and stability.BTAL combines a strategy of going long on low-beta stocks and shorting high-beta stocks. It is a market-neutral strategy that helps to balance a portfolio. A 5% position of your overall holdings in a market-neutral is a good rule of thumb.
It is a very simple and easy way to give your portfolio dow

See all ideas
Summarizing what the indicators are suggesting.
Oscillators
Neutral
SellBuy
Strong sellStrong buy
Strong sellSellNeutralBuyStrong buy
Oscillators
Neutral
SellBuy
Strong sellStrong buy
Strong sellSellNeutralBuyStrong buy
Summary
Neutral
SellBuy
Strong sellStrong buy
Strong sellSellNeutralBuyStrong buy
Summary
Neutral
SellBuy
Strong sellStrong buy
Strong sellSellNeutralBuyStrong buy
Summary
Neutral
SellBuy
Strong sellStrong buy
Strong sellSellNeutralBuyStrong buy
Moving Averages
Neutral
SellBuy
Strong sellStrong buy
Strong sellSellNeutralBuyStrong buy
Moving Averages
Neutral
SellBuy
Strong sellStrong buy
Strong sellSellNeutralBuyStrong buy
Displays a symbol's price movements over previous years to identify recurring trends.
Frequently Asked Questions
An exchange-traded fund (ETF) is a collection of assets (stocks, bonds, commodities, etc.) that track an underlying index and can be bought on an exchange like individual stocks.
BTAL trades at 16.85 USD today, its price has risen 2.31% in the past 24 hours. Track more dynamics on BTAL price chart.
BTAL net asset value is 16.77 today — it's fallen 6.34% over the past month. NAV represents the total value of the fund's assets less liabilities and serves as a gauge of the fund's performance.
BTAL assets under management is 321.66 M USD. AUM is an important metric as it reflects the fund's size and can serve as a gauge of how successful the fund is in attracting investors, which, in its turn, can influence decision-making.
BTAL price has fallen by −5.76% over the last month, and its yearly performance shows a −13.05% decrease. See more dynamics on BTAL price chart.
NAV returns, another gauge of an ETF dynamics, have fallen by −6.34% over the last month, showed a −15.05% decrease in three-month performance and has decreased by −10.57% in a year.
NAV returns, another gauge of an ETF dynamics, have fallen by −6.34% over the last month, showed a −15.05% decrease in three-month performance and has decreased by −10.57% in a year.
BTAL fund flows account for 143.35 M USD (1 year). Many traders use this metric to get insight into investors' sentiment and evaluate whether it's time to buy or sell the fund.
Since ETFs work like an individual stock, they can be bought and sold on exchanges (e.g. NASDAQ, NYSE, EURONEXT). As it happens with stocks, you need to select a brokerage to access trading. Explore our list of available brokers to find the one to help execute your strategies. Don't forget to do your research before getting to trading. Explore ETFs metrics in our ETF screener to find a reliable opportunity.
BTAL invests in cash. See more details in our Analysis section.
BTAL expense ratio is 1.43%. It's an important metric for helping traders understand the fund's operating costs relative to assets and how expensive it would be to hold the fund.
No, BTAL isn't leveraged, meaning it doesn't use borrowings or financial derivatives to magnify the performance of the underlying assets or index it follows.
In some ways, ETFs are safe investments, but in a broader sense, they're not safer than any other asset, so it's crucial to analyze a fund before investing. But if your research gives a vague answer, you can always refer to technical analysis.
Today, BTAL technical analysis shows the neutral rating and its 1-week rating is sell. Since market conditions are prone to changes, it's worth looking a bit further into the future — according to the 1-month rating BTAL shows the sell signal. See more of BTAL technicals for a more comprehensive analysis.
Today, BTAL technical analysis shows the neutral rating and its 1-week rating is sell. Since market conditions are prone to changes, it's worth looking a bit further into the future — according to the 1-month rating BTAL shows the sell signal. See more of BTAL technicals for a more comprehensive analysis.
Yes, BTAL pays dividends to its holders with the dividend yield of 1.27%.
BTAL trades at a premium (0.49%).
Premium/discount to NAV expresses the difference between the ETF’s price and its NAV value. A positive percentage indicates a premium, meaning the ETF trades at a higher price than the calculated NAV. Conversely, a negative percentage indicates a discount, suggesting the ETF trades at a lower price than NAV.
Premium/discount to NAV expresses the difference between the ETF’s price and its NAV value. A positive percentage indicates a premium, meaning the ETF trades at a higher price than the calculated NAV. Conversely, a negative percentage indicates a discount, suggesting the ETF trades at a lower price than NAV.
BTAL shares are issued by AGF Management Ltd.
BTAL follows the No Underlying Index. ETFs usually track some benchmark seeking to replicate its performance and guide asset selection and objectives.
The fund started trading on Sep 13, 2011.
The fund's management style is active, aiming to outperform its benchmark index by actively selecting and adjusting assets. The goal is to achieve returns that exceed those of the index the fund tracks.