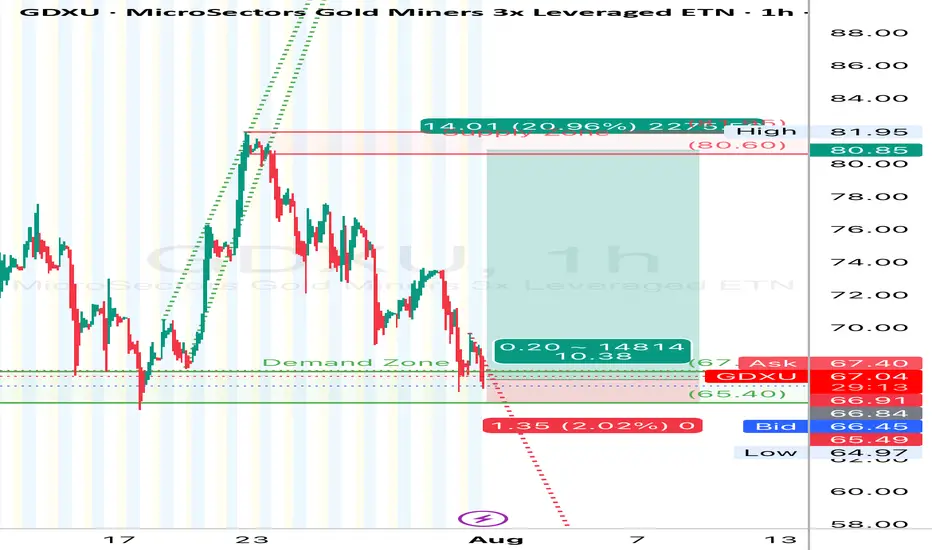
GDXU (Gold Miners 3x Bull ETF) Long SetupGDXU (Gold Miners 3x Bull ETF) | 1H Chart**
**The Fed held rates flat**, signaling a potential **pause or pivot**, which gave a bullish jolt to gold and miners.
* Lower rate expectations = weaker dollar = stronger gold = **GDXU gets rocket fuel**.
* This macro tailwind is **highly favorable** for leveraged gold miners in the short term.
* Strong rally from the \$65 zone may mark the beginning of a **Wave 3** move after a clean corrective structure.
* Impulse leg looks textbook — higher highs and rising momentum suggest bulls are in control.
* **Demand Zone:** \$65.00–\$67.33 — **key structure support that's held multiple times**, proving itself as a strong accumulation zone throughout July.
* **Supply Zone:** \$80.60–\$81.95 — recent rejection area; heavy volume and selling pressure reside here.
That \$65–67 demand zone? Straight-up Fort Knox. It’s been the bulls' home base all month. Now toss in the Fed holding rates and gold catching a bid — GDXU’s primed like TNT under \$82.”
🎯 **Long Trade Setup:**
* **Entry:** \$67.33
* **Stop Loss:** \$65.49
* **Take Profit 1:** \$80.60
* **Take Profit 2:** \$81.95
* **Risk/Reward:** \~**5.0 R**
*“Markets are driven by perception and momentum, not certainty.” – Stanley Druckenmiller*
#### ⚠️ **Disclaimer:**
This is not financial advice. Chart setups are for educational purposes only. Always do your own research, use stop-losses, and apply sound risk management.
BULZ trade ideas
Double Top Alert on $FNGS!🟠 Double Top Alert on AMEX:FNGS 🟠
Price just got rejected at the 100% Fibonacci extension around $56 — a textbook resistance level.
Bearish confirmation could send us down to fill the gap at $48.35 👇
⚠️ Watch $54.30 as the critical neckline!
📉 Rejection + Gap = Potential Opportunity

Inverse gold miner3x inverse gold miner for short exposure bought this morning at 4.50. Looking at 9 for first target see if gold bounces at support should be around that range. Could easily bounce sooner but short/medium term I'm looking for gold back at 3050. Weekly gold candle is setting up for major top if it doesn't rebound this week. Risky play I have a .15 stoploss.

Who Benefits from the Dunce Tariff Tsar? The Art of The Short: When SPY Bleeds, Dracula Drinks
Today we’re diving deep into the MAX S&P 500 4X Leveraged ETN (SPYU), the ultimate degenerate’s playground for snorting the market when SPY takes a nosedive.
Tonight, my fellow nightwalkers, I wipe my mouth after my fangs bite into MAX S&P 500 4X Leveraged ETN (SPYU) the juiciest vein in the market’s pale white supremisist neck, ripe for snorting when SPY collapses under the weight of its own mortal greed. I’m Dracula, your undead degen, and I’ve been snorting the lifeblood of Wall Street since the days of ticker tape and blood-soaked ledgers. Let’s feast.
Picture this: it’s 2025, Trump’s slapping tariffs on everything from iPhones to tacos, and the S&P 500’s staggering like a peasant drained dry. SPY’s down 5% in a day, a crimson river flowing for weeks. With SPYU’s 4x leverage, that ETN’s plummeting 20% faster than you can hiss “inverse gang rise up.” You bulls might clutch your pearls, or buy the dip but baby, you just giving me that drip, drip, drip.
Here’s the blood ritual: I summon my broker under the moonlight, borrow SPYU shares, sell ‘em at their bloated peak, and slink back to my coffin until the orange man dumps on the market. When SPYU’s rallies, I buy ‘em back, pocketing the difference—20% gains, minus the broker’s measly tithe and some bat-winged fees. The leverage is my coffin nail, amplifying SPY’s death throes into a banquet of tendies. But volatility decay’ll stake you faster than a hedgie fleeing a short squeeze. Snort quick, my pretties.
Disclaimer: This is unholy entertainment, not mortal advice. Snorting’s riskier than a sunrise stroll, and you could lose your crypt. Do your own necromancy, don’t YOLO your blood money, and maybe consult a living advisor instead of a WSB vampire. Markets are feral, tariffs are feraler, and SPYU’s the feralest. Feast wise, or crumble to dust.
What in the Nosferatu Is SPYU, and Why’s It My Prey?
Listen up, you sun-kissed ghouls. SPYU ain’t some mortal ETF and it’s an exchange-traded note, a dark pact scrawled by the Bank of Montreal (BMO), swearing to bleed 4x the daily pulse of the S&P 500 Total Return Index. Four times the thrill, you hear me? If SPY, that sanctimonious index hog, rises 1%, SPYU surges 4%, a moonlit frenzy. But when SPY stumbles 1%, SPYU’s gutted by 4%, and that’s when I, Dracula, snort its essence like fresh blood from a virgin’s neck. It’s my chalice of chaos.
Why care? Because the market’s a bloated corpse waiting to be drained, and Trump’s tariffs are the silver dagger. When SPY bleeds, SPYU’s leverage makes it a four-course meal for us snortin’ fiends. The mortals weep; I feast.
Bank of Montreal: The Crypt-Keepers Who Sip Regardless
SPYU’s birthed by Bank of Montreal—pale Canucks who guzzle maple syrup and hedge under torchlight. As an ETN, it’s no stock hoard, it’s a blood oath, with BMO bound to pay 4x the S&P’s dance. When SPY falls and SPYU’s carcass sinks, BMO’s debt shrivels, like a thrall freed from my thrall. Are they cackling over goblets? Not quite.
These coffin-dwellers don’t wager their vault on market whims. They weave dark hedges swaps, futures, maybe cursed options traded in shadow pools. When SPY bleeds, their short futures might fatten their coffers, balancing the SPYU tab. But the true leeching? A 2.95% expense ratio, sucked from your veins whether SPY soars or sinks. It’s their eternal tithe for the win, lose, or draw, they’re sipping.
And the twist of the fang? BMO might pawn some risk to swap thralls, other banks, hedge funds, or their own brood. When SPY tanks, those on the hedge’s far side might choke on losses, but their names are buried deeper than my Transylvanian crypt. Prospectuses are murkier than a fog-draped moor, and BMO ain’t etching their secrets in blood. My bet? They keep it in-clan or with beasts who can bear the bite. The real feast is mine (snorting SPYU) and theirs (skimming fees).
Trump’s Tariffs: The Rocket Fuel for SPYU Shorts
Let’s talk about the big dunce red elephant in the room: Trump’s tariffs. The man’s got a hard-on for trade wars, and 2025’s looking like a sequel to his 2018 tariffpalooza. The 25% tariffs on Mexico and Canada, 102% on China, and who knows what else. Why’s this a big deal? Tariffs jack up import costs, screw over supply chains, and make everything from cars to CPUs pricier. Companies like Apple, Walmart, and Tesla, big S&P 500 names get hit hard, and SPY feels the pain.
When SPY drops, SPYU’s 4x leverage turns a market dip into a bloodbath and that makes my fangs erect like a male pornstar on viagra. Say Trump slaps a more tariff on Chinese goods, and SPY falls another 15% as tech stocks puke. Do the math on how much SPYU goes down in a day. Scale that up with a big position, and you’re buying Lambos while the bulls are crying into their maga cool aid.
But tariffs don’t just hit stocks, they spook the whole market. Investors panic, volatility spikes, and leveraged products like SPYU get wild. That’s your cue to strike. The VIX (fear index) shoots up during tariff tantrums, and SPYU’s daily resets mean bigger swings. If you’re nimble, you can ride those red days for fat gains. Just don’t get greedy—tariff news is noisy, and markets can bounce on a single Trump tweet (or whatever he’s posting on Truth Social these days).
See that little, indicator I cant publish?
Oh, and my little bat-trick? The Sector Value Index (SVI)—my ancient grimoire. It tracks RSI and MFI across SPY’s veins, averages the pulse, and measures the gap to the index. Overbought or oversold, it whispers when the market’s ripe for snorting. When SVI screams “sell,” I pounce.

FUGU is important now FNGU is important now
now key price
now daily 200 ma support
--------------------------------------------------
if break down key price expect $150
if bounce from here expect $796
based on price action


FNGS. Beautiful Breakout on High VolumeWill be looking for entry on a lower timeframe like a 15 min chart.

SHORT GOLD! BUY INVERSE ETFSGold is extended. period
we are due for a pullback.
either short gold, or BUY reverse ETFS.
Manage risk accordingly!

Comparing the new SPYU to UPRO and SPXLI am not sure if anyone else noticed, because quite frankly I completely missed it, but there is a new leveraged share on the block that aims to track the S&P 500 ( SP:SPX ). That ticker is $SPYU.
Now this isn’t a conventional leveraged share. Most leveraged shares are between 2 x to 3 x max. However, this one is 4 x. Yeah, you read it correctly, 4 x the S&P. So if the S&P moves 2%, your theoretical gains are 8%.
Now there are inherent risks with leveraged share usage, which I have spoken about before. Now I am not going to get into the risks involved with over-leveraging yourself. I feel like there is enough cautionary tales, both from me and others, about such travesties. But what I want to cover in this post is really just an evaluation of SPYU vs the popular others, such as SPXL and UPRO. For me, my go to has always been UPRO; however, this new one intrigued me so decided to look at it a little more closely.
Overview
SPYU was launched in December of 2023. Surprisingly, despite being an ETF that tracks and American index and is listed on the NYSE, this leveraged ETF is managed by a Canadian institution, the Bank of Montreal. While it is a little strange to see the Bank of Montreal offering such an asset as an American asset, this bank is well known in Canada for offering multiple types of ETFs with exposure to both American and Canadian industries. I myself have many of their products and have been pleased with the returns!
Owning to SPYU’s short-ish existence, its difficult to really make long term predictions about how this will hold up over time. But I have done some comparative analysis on SPYU, UPRO and SPXL, using SPY as a benchmark, to see how SPYU has performed in its short timespan. So let’s get into the results.
Correlation:
Generally, the first thing you want to look at when identifying a leveraged share is the correlation. If a leveraged ETF tracks the underlying well, you are going to see a high correlation. If it struggles to track the underlying well, you will see a correlation with a lot of ‘variance’. Variance just means deviation from what would be, generally, a statistically strong relationship.
So let’s take a look at our 3 amigos in relation to SPY:
In the chart above, we are looking at the correlation of SPYU, UPRO and SPXL in relation to SPY over a rolling 14 period lag (in other words, a 14 day time period).
Purple represents UPRO, green SPXL and Aqua SPYU. In the legend on the right, you can see the max and min correlation of the various leveraged ETFs in relation to SPY. We see that UPRO and SPYU are pretty much on par with each other, with a correlation of roughly 0.97 to 0.98. This would equate to a variance of 0.04 (a perfect correlation has a score of 1, which would be the benchmark to compare the degree of variance or drift from the ability to track the underlying). This is, from a statistical perspective, fantastic! For most instances, we would say this is pretty much on par with a perfect correlation.
The same is technically true for SPXL. SPXL has a min correlation of 0.96, which equates to a variance of around 0.05, only 0.01% more than the other 2 ETFs. Statistically, these tickers are indistinguishable and there really is no statistically significant difference observed between their ability to track the underlying.
What about Slippage and Returns?
Slippage, which can be the result of contango and other factors, refers to a type of “loss in value” so to speak (AKA DECAY!!!). Essentially what it means is, is the ETF delivering what it says to deliver. In SPYU’s case, it says it delivers 4 x that of the S&P (or SPY). No leveraged ETF will ever be able to perfectly match their quoted returned consistently, owning to normal market volatility. However, what we want to see in a good leveraged share is very little slippage. In other words, we want to see a leveraged ETF that more frequently returns what it promises than doesn’t.
To measure this, we can use an indicator I developed a while ago called leveraged share decay tracker ().
Let’s kick it off with SPY vs SPYU:
In this chart, we can see that over a short period of time (under 100 days), the average slippage of SPYU is around 2.4%. For the most part. We can see this quantified in variance (the difference in correlation) and drift (the monetary measure of variance). This means that, at approximately 100 days, the variance in the potential loss or gain is around $1.72. At 30 days, it is $0.25.
This means, theoretically, you could be down $1.72 per share, if you intended to hold for approximately 100 days. Now, this $1.72 could be meaningless if the ETF managed to offer around the quoted returns, and indeed, it seems that it does. At 100 days, the expected return would be 42.65%, based on SPY’s trajectory. The actual return was 31.88%. This is a 10.77% difference. Had you traded SPY directly, you would be up about 21%. So the 10% slippage kind of evens out in that sense, because you are still up more than 10% than the actual underlying itself.
But wait, we need to check how the other leveraged ETFs perform. Let’s look at UPRO and SPY next:
So, remember UPRO promises 3 x the leverage, so the returns will likely be less than the returns on SPYU, which offers 4 x the leverage. Looking at this, we can see the average % slippage is about 0.40%. The average monetary slippage is about 0.40$. And finally, if you held for 100 days, you would only have a slippage of around 3%. So had you invested in SPY in December of 2023 , your returns would have been about 21% and your returns on UPRO would have been about 28%.
And finally, let’s take a look at SPXL:
Remember, SPXL promises to deliver 3x the exposure to the S&P, similar to that of UPRO.
You can see it’s pretty identical to UPRO:
UPRO seems to drift a bit more than SPXL; however, the difference is not statistically significant. The $ amount is also equivalent, taking into account that SPXL is approximately 1.5 x the cost of UPRO.
Cointegration
And finally, the last way to visualize how effective leveraged shares are at tracking the underlying is by creating a co-integration regression. This uses the price of the leveraged share to predict the price of the underlying. A leveraged share with a good relationship will be on point in predicting the price of the underlying. One that struggles will have frequent drifts and deviations from the price of the underlying. Here is all 3 tickers, compared to SPY (SPY represented by the red dotted line):
From here, we can see qualitatively that SPXL tends to have more dramatic swings in both directions, then UPRO or SPYU. However, SPYU and UPRO tend to perform identically.
So what’s the verdict on SPYU and the Leveraged trio as a whole?
My go to for trading SPY has been UPRO. As I just recently learned about SPYU I plan to make the shift here. The results of these analysis show that, from a statistical standpoint, the differences are marginal and not significant.
If you want to nail it down to “which is the MOST significant within the significance” so to speak, the winners here can be grouped by desired outcome. Here they are:
Returns focus:
If its returns you want, its SPYU you should do. SPYU will deliver up and above the returns of UPRO or SPXL, even in light of the drift and slippage. Under 100 days, the slippage shouldn’t be objectively notable. It will only become apparent at the 100 day mark or longer; however, SPYU still manages to deliver returns that surpass both UPRO and SPXL at that time point.
Risk Management:
Risk management has to go to SPXL, for the lack of slippage associated over the longer term. While SPXL does have a little wider variance, it manages to have the lowest slippage in percent and money drift. SPXL frequently delivers on what it promises.
And that’s it folks! Hope you enjoyed!
Safe trades as always!

NRGU looks good at 61.8 retrace and pitchfork supportPretty simple setup. we had a nice neat pullback to the full 61.8 and we're on a trendline. I'm long NRGU. Oil has been going up, likely to be interest in oil companies.

GDXD 1M Twirl That Cash For Gold SignGold is no haven...not at least as far as I can see.
It is not a buy-and-hold product, and is best designed for short-term tactical trading purposes only. Returns can vary significantly from -3x exposure to its underlying index if held for longer than a day. Are you looking for something to buy hold or you mean trading short term?
The Fund seeks three times leveraged participation in the daily inverse performance of the S-Network MicroSectors Gold Miners Index. The Index is a total return index that tracks the performance of two exchange traded funds, the VanEck Vectors Gold Miners ETF and the VanEck Vectors Junior Gold Miners ETF

Short term play idea: FNGD on the 4H ChartI'm entering a long position in FNGD today at market open using 60% of my equity.
Why:
RSI momentum positive.
RSI about to cross 55. I consider he path between 55 and 70 an ideal long.
FNGD is sitting on 8,13 and 21 period EMAs providing possible support.
Stop Loss:
4%
Will move up manually is it goes in my favor.
Risks:
There's a FVG area aroun $3.78
Price might pullback down there putting me in drawdown.
I've decided not to wait for this pullback as I beleive there is enough momentum in the open.
Additional thoughts:
NQ Futures seem overbought on short timeframes suggesting a swing to the downside in the morning.
Lets see how it goes!

Bullish short GDXD :DLet go! It looks like we are soft landing and the gold and silver bugs are gonna feel it.

NRGU Oil TRENDS AND PRICE TARGETS900 is run up numbers on a trend breakout, but it will see resistance at 730.
Everything is marked. This is a longer term chart.
notice 630, 560 and 460
Those rejection trends are leading right towards those higher numbers.
gl
-n

FNGU - MicroSectors FANG Index 3x ETN 1/8/2023DPO 62 being used with chart TA above the 0 and below the 0 line. No Options on MaxPain maximum-pain.com Must trade this as cash.

FNGD retrace to $8.50 before target of $10.51, coil/fakeout/pumpFNGD to go back down to $8.50 before target of $10.51 Nxt
I'm expecting a little retracement back to $8.51 with buy limits set from 8.88 down to 8.51
Take Profits at $10.17 and $10.51
Expect to retrace again and coil up. People will be talking about bears taking over, but the Santa rally will cheer bulls up and give them hope... meanwhile we are playing both sides.
Into 2024:
Due to everything going on and how much this market has tripped everyone up and out, I expect a double fakey to occur. FNGD will appear to be pumping (bears winning on FNGU and S&P) then the bulls will appear to take control and the descending triangle on the S&P will appear to have a breakout to the upside only to fail.
People will say its due to a news event, but the Operator/Fed is planning this. Equities will retreat to safety of Bonds. S&P will Fall, and lay off employees, people will beg for the Fed to cut rates and when they do Bonds will explode then Gold then after Equities and Crypto Capitulation we will rebuild on the scorched earth.
BUY BUY BUY WHEN THERE IS BLOOD IN THE STREETS IN MARCH/APRIL 2024!

Quick Flipjust bought hopefully towards the bottom of this over sold move and will be selling between 147-157.69
that should be a quick 20% build off of the 20% made on FNGD
That may be my last trade. Possibly go into FNGD again at the top but may be looking for a VIX play to go off volitivity

NRGU - Trying to BottomBecause yellow iv slipped below wave i, it would appear that we are now on the aqua colored count. Interestingly, both counts get to the same points, they just have different names. Instead of a yellow 1 for instance, it will now be an aqua circle A. Hopefully, we've now bottomed and we can start climbing to these points, regardless of how they're labeled.

NRGU - was it a 3rd Wave or a 3 wave 1st WaveHit the yellow 3 a bit early, giving reason to think we might be on the aqua colored count. We'll know that it drops below 480 ish. If it pivots on the yellow 4, we can expect it to stay on yellow count.

GDXU - It's time for a pull backWave i was strong enough to break the resistance line only to fall back to ii. It looks like a false breakout but it's right on plan. Look for a pullback to the 24 range.

Love 3rd WavesMoving into the 5th of III with momentum after a very shallow wave 4. Moving with purpose and it looks like a great candidate for an extended 5th wave (as shown). If it does extend, I see it reaching 566. If it doesn't extend, I see a high in the range 540 to 550.


FNGU- Technology Titans CounterTrend LONG on ReversalFNGU on the 4H chart is in a trend down within a parallel channel. The previous trend down
from the top of the channel to the bottom was 29% while the counter counter-trend up from
the bottom of channel to the top was 18% over 7 days. Presenly the trend down from the
upper channel is confirmed by the two RS lines near to the 50 level and the Awesome Oscillator
with a down going signal. Trade plan - I will trade FNGU short ( or FNGD long ) until it is at
the bottom of the channel. Upon reaching it and mindful of a fake breakdown. I will watch for
reversal signs on a lower TF and upon finding them in the MACD or Bollinger Bands or VWAP
bands I will close the trade and so long instead.
