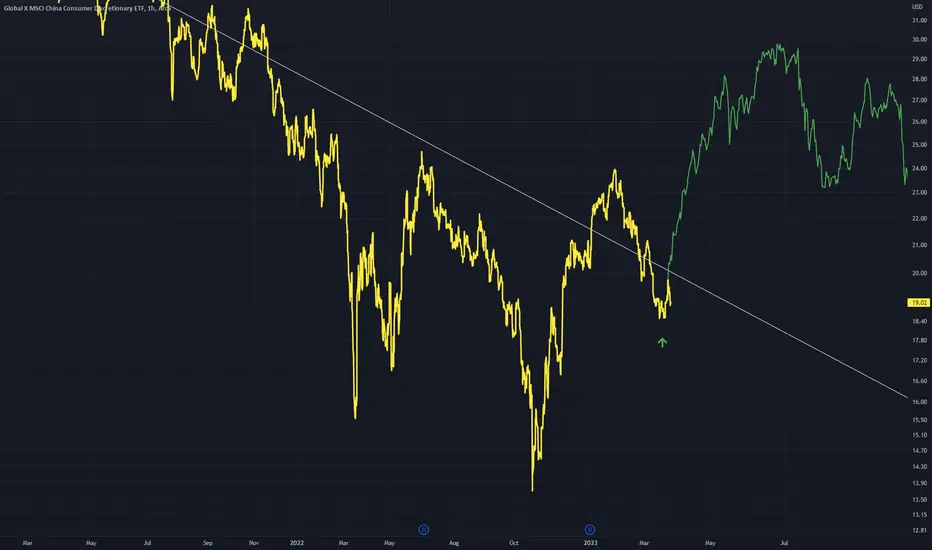
CHIQ - Inverted H&S IntradayCHIQ has formed a nice inverted H&S on this daily timeframe
Currently CHIQ is within a nice bull stretch and is looking to find support and this is the pattern that can provide that
Left shoulder, Head, Right Shoulder
Bounce off the downtrend line (shown with up arrow)
Key stats
About Global X MSCI China Consumer Discretionary ETF
Home page
Inception date
Nov 30, 2009
Structure
Open-Ended Fund
Replication method
Physical
Dividend treatment
Distributes
Distribution tax treatment
Qualified dividends
Income tax type
Capital Gains
Max ST capital gains rate
39.60%
Max LT capital gains rate
20.00%
Primary advisor
Global X Management Co. LLC
Distributor
SEI Investments Distribution Co.
CHIQ targets an increasingly popular investment theme within Chinathe consumer. While this vanilla fund provides a representative exposure to the consumer discretionary sector, it notably excludes small-caps and places position limits on the largest names. CHIQ includes all the major share classes: A, B, and H shares, red chips, P chips, and foreign listings. Additionally, the funds quarterly-rebalanced index uses a 10/50 capping methodology for its market-cap-weighting. Prior to December 6, 2018, CHIQ tracked an index of companies in both the consumer discretionary and consumer staples sectors.
Related funds
Classification
What's in the fund
Exposure type
Retail Trade
Consumer Durables
Consumer Services
Producer Manufacturing
Stock breakdown by region
Top 10 holdings
Low Risk, High Returns ETF - CHIQPlease DYODD as usual as this writing is merely my opinion and is to be taken as purely educational or entertainment, if you like. Your money is your money and nobody should tells you what to do! Remember that !
Now, with the last hurdles that China is now working on - the reopening of China border

CHIQ - Triple Bottom Continuation IdeaCHIQ has formed some interesting structures within the dominant Fibonacci circle
Triple bottoms can be seen
Right now price can be seen to be in an area which could possibly be seen as a place for one of these triple bottoms to occur (in green bars pattern) leading to the climb out of 3.618

China's Consumer Discretionary ETFFrom the beginning of 2020, emerging markets, and specially China, had been really outperforming.
The sector has taken a 12% correction from its high on February 16th. Which was coincidental with the past sell signals from the drawn channel.
We have tested the 50sma, which has worked as the low

See all ideas
Summarizing what the indicators are suggesting.
Oscillators
Neutral
SellBuy
Strong sellStrong buy
Strong sellSellNeutralBuyStrong buy
Oscillators
Neutral
SellBuy
Strong sellStrong buy
Strong sellSellNeutralBuyStrong buy
Summary
Neutral
SellBuy
Strong sellStrong buy
Strong sellSellNeutralBuyStrong buy
Summary
Neutral
SellBuy
Strong sellStrong buy
Strong sellSellNeutralBuyStrong buy
Summary
Neutral
SellBuy
Strong sellStrong buy
Strong sellSellNeutralBuyStrong buy
Moving Averages
Neutral
SellBuy
Strong sellStrong buy
Strong sellSellNeutralBuyStrong buy
Moving Averages
Neutral
SellBuy
Strong sellStrong buy
Strong sellSellNeutralBuyStrong buy
Displays a symbol's price movements over previous years to identify recurring trends.
Frequently Asked Questions
An exchange-traded fund (ETF) is a collection of assets (stocks, bonds, commodities, etc.) that track an underlying index and can be bought on an exchange like individual stocks.
CHIQ trades at 22.26 USD today, its price has fallen −0.18% in the past 24 hours. Track more dynamics on CHIQ price chart.
CHIQ net asset value is 22.30 today — it's risen 4.87% over the past month. NAV represents the total value of the fund's assets less liabilities and serves as a gauge of the fund's performance.
CHIQ assets under management is 244.42 M USD. AUM is an important metric as it reflects the fund's size and can serve as a gauge of how successful the fund is in attracting investors, which, in its turn, can influence decision-making.
CHIQ price has risen by 3.01% over the last month, and its yearly performance shows a 36.90% increase. See more dynamics on CHIQ price chart.
NAV returns, another gauge of an ETF dynamics, have risen by 4.87% over the last month, showed a 8.62% increase in three-month performance and has increased by 38.84% in a year.
NAV returns, another gauge of an ETF dynamics, have risen by 4.87% over the last month, showed a 8.62% increase in three-month performance and has increased by 38.84% in a year.
CHIQ fund flows account for −16.60 M USD (1 year). Many traders use this metric to get insight into investors' sentiment and evaluate whether it's time to buy or sell the fund.
Since ETFs work like an individual stock, they can be bought and sold on exchanges (e.g. NASDAQ, NYSE, EURONEXT). As it happens with stocks, you need to select a brokerage to access trading. Explore our list of available brokers to find the one to help execute your strategies. Don't forget to do your research before getting to trading. Explore ETFs metrics in our ETF screener to find a reliable opportunity.
CHIQ invests in stocks. See more details in our Analysis section.
CHIQ expense ratio is 0.65%. It's an important metric for helping traders understand the fund's operating costs relative to assets and how expensive it would be to hold the fund.
No, CHIQ isn't leveraged, meaning it doesn't use borrowings or financial derivatives to magnify the performance of the underlying assets or index it follows.
In some ways, ETFs are safe investments, but in a broader sense, they're not safer than any other asset, so it's crucial to analyze a fund before investing. But if your research gives a vague answer, you can always refer to technical analysis.
Today, CHIQ technical analysis shows the buy rating and its 1-week rating is buy. Since market conditions are prone to changes, it's worth looking a bit further into the future — according to the 1-month rating CHIQ shows the buy signal. See more of CHIQ technicals for a more comprehensive analysis.
Today, CHIQ technical analysis shows the buy rating and its 1-week rating is buy. Since market conditions are prone to changes, it's worth looking a bit further into the future — according to the 1-month rating CHIQ shows the buy signal. See more of CHIQ technicals for a more comprehensive analysis.
Yes, CHIQ pays dividends to its holders with the dividend yield of 2.23%.
CHIQ trades at a premium (0.18%).
Premium/discount to NAV expresses the difference between the ETF’s price and its NAV value. A positive percentage indicates a premium, meaning the ETF trades at a higher price than the calculated NAV. Conversely, a negative percentage indicates a discount, suggesting the ETF trades at a lower price than NAV.
Premium/discount to NAV expresses the difference between the ETF’s price and its NAV value. A positive percentage indicates a premium, meaning the ETF trades at a higher price than the calculated NAV. Conversely, a negative percentage indicates a discount, suggesting the ETF trades at a lower price than NAV.
CHIQ shares are issued by Mirae Asset Global Investments Co., Ltd.
CHIQ follows the MSCI China Consumer Discretionary 10/50 Index. ETFs usually track some benchmark seeking to replicate its performance and guide asset selection and objectives.
The fund started trading on Nov 30, 2009.
The fund's management style is passive, meaning it's aiming to replicate the performance of the underlying index by holding assets in the same proportions as the index. The goal is to match the index's returns.