Key stats
About United States Copper Index Fund ETV
Home page
Inception date
Nov 15, 2011
Structure
Commodities Pool
Replication method
Synthetic
Dividend treatment
Capitalizes
Distribution tax treatment
No distributions
Income tax type
60/40
Max ST capital gains rate
27.84%
Max LT capital gains rate
27.84%
Primary advisor
United States Commodity Funds LLC
Distributor
ALPS Distributors, Inc.
CPER is a commodity pool tracking copper futures contracts on COMEX. The fund uses a complex optimization process to select two or three contracts each month in an attempt to mitigate the effects of contango. Contracts are selected using quant analysis on prices of eligible copper futures, developed by Summer Haven Index Management. Because of the fund`s commodity pool structure, investors will pay a blended tax rate on capital gains regardless of how long they`ve held it, and will receive a K-1 at tax time.
Related funds
Classification
What's in the fund
Exposure type
Futures
Cash
Bonds, Cash & Other100.00%
Futures53.73%
Cash42.04%
Government4.22%
Top 10 holdings

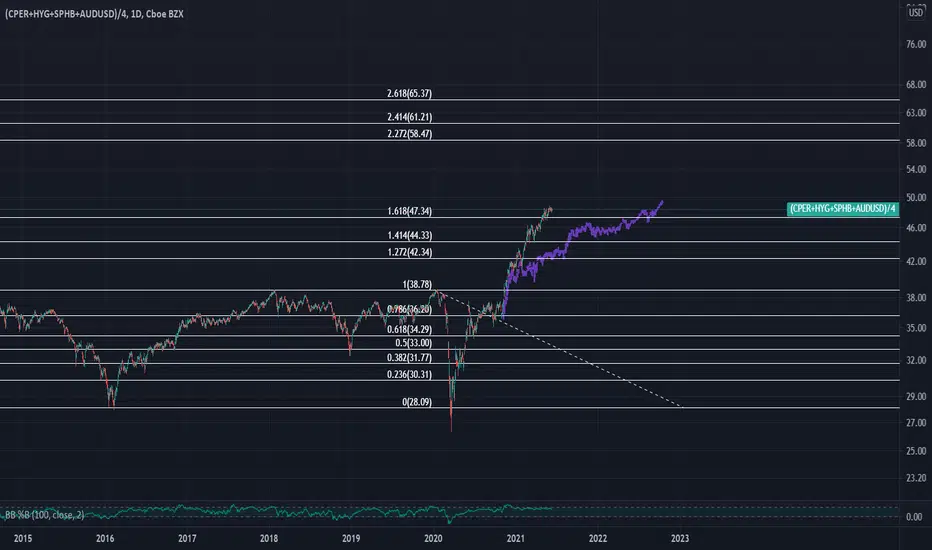
Big divergence between $SPX & $CPERThis probably is not a good sign for the SP:SPX , as these assets are highly correlated (0.88) and normally AMEX:CPER leads the business cycle.
Also, the TVC:VIX is back above 20 and NASDAQ:TLT hasn't resume its downtrend.
Even the dollar AMEX:UUP is showing strength again.
I'm 87% in c

CPER see brrrrLooking at the weekly chart with 200MA for CPER. I'm a fan of owning physical metals but CPER is a nice way for people to dabble in copper without actually getting bullion.
The 200MA is now coinciding with the lower boll band. On a weekly chart I'd expect this to serve as rock solid support. I've

Economic Game Mechanics: Part 3DISCLAIMER
This is in no way, shape or form, fluid and function, an analytical, qualitative or intelligent compte rendu. The function of this essay is the maddening diatribe of a curious author, and how this one manages micro- and macro-economic data for a critical investigation into the micro- and

Weekly Bullish Harami with Hidden Bullish DivergenceThe 2022 call options for this one seems like a good play. Or you could buy some shares but im going the route of options.

Copper in line with Mkt breath weakness. Potential correctionCopper in line with Mkt breath weakness. Potential correction

Copper Trend intactCopper has a strong uptrend with a stair-step behavior.
With pent-up demand for semi-conductors, copper mining has been increasing to help suppliers.
For in depth analysis, please check my last charts on CPER.

Copper Price should move on!Even the news shows different?
Who trust China claiming it will prevent raising prices? Really?
They only interested to put the price down to buy more copper! Think about it? Why should china help us?
See also money flow in this ETF: etfdb.com
So large volume still goes in this ETF and this for

Copper close to complete the measured move!Copper has a healthy stair-step trend, with mid-term consolidations after big rally's, as drawn in chart.
We are about to make the measured move which I projected in my last chart on this ETF, at this point I expect we could enter a period of consolidation.
Risk Management
I will tight my exits

See all ideas
Summarizing what the indicators are suggesting.
Oscillators
Neutral
SellBuy
Strong sellStrong buy
Strong sellSellNeutralBuyStrong buy
Oscillators
Neutral
SellBuy
Strong sellStrong buy
Strong sellSellNeutralBuyStrong buy
Summary
Neutral
SellBuy
Strong sellStrong buy
Strong sellSellNeutralBuyStrong buy
Summary
Neutral
SellBuy
Strong sellStrong buy
Strong sellSellNeutralBuyStrong buy
Summary
Neutral
SellBuy
Strong sellStrong buy
Strong sellSellNeutralBuyStrong buy
Moving Averages
Neutral
SellBuy
Strong sellStrong buy
Strong sellSellNeutralBuyStrong buy
Moving Averages
Neutral
SellBuy
Strong sellStrong buy
Strong sellSellNeutralBuyStrong buy
Displays a symbol's price movements over previous years to identify recurring trends.
Frequently Asked Questions
An exchange-traded fund (ETF) is a collection of assets (stocks, bonds, commodities, etc.) that track an underlying index and can be bought on an exchange like individual stocks.
CPER trades at 27.30 USD today, its price has fallen −19.31% in the past 24 hours. Track more dynamics on CPER price chart.
CPER net asset value is 34.63 today — it's risen 10.06% over the past month. NAV represents the total value of the fund's assets less liabilities and serves as a gauge of the fund's performance.
CPER assets under management is 228.46 M USD. AUM is an important metric as it reflects the fund's size and can serve as a gauge of how successful the fund is in attracting investors, which, in its turn, can influence decision-making.
CPER price has fallen by −10.32% over the last month, and its yearly performance shows a 4.24% increase. See more dynamics on CPER price chart.
NAV returns, another gauge of an ETF dynamics, have risen by 10.06% over the last month, showed a 20.72% increase in three-month performance and has increased by 35.26% in a year.
NAV returns, another gauge of an ETF dynamics, have risen by 10.06% over the last month, showed a 20.72% increase in three-month performance and has increased by 35.26% in a year.
CPER fund flows account for 1.89 M USD (1 year). Many traders use this metric to get insight into investors' sentiment and evaluate whether it's time to buy or sell the fund.
Since ETFs work like an individual stock, they can be bought and sold on exchanges (e.g. NASDAQ, NYSE, EURONEXT). As it happens with stocks, you need to select a brokerage to access trading. Explore our list of available brokers to find the one to help execute your strategies. Don't forget to do your research before getting to trading. Explore ETFs metrics in our ETF screener to find a reliable opportunity.
CPER invests in cash. See more details in our Analysis section.
CPER expense ratio is 0.97%. It's an important metric for helping traders understand the fund's operating costs relative to assets and how expensive it would be to hold the fund.
No, CPER isn't leveraged, meaning it doesn't use borrowings or financial derivatives to magnify the performance of the underlying assets or index it follows.
In some ways, ETFs are safe investments, but in a broader sense, they're not safer than any other asset, so it's crucial to analyze a fund before investing. But if your research gives a vague answer, you can always refer to technical analysis.
Today, CPER technical analysis shows the strong sell rating and its 1-week rating is sell. Since market conditions are prone to changes, it's worth looking a bit further into the future — according to the 1-month rating CPER shows the neutral signal. See more of CPER technicals for a more comprehensive analysis.
Today, CPER technical analysis shows the strong sell rating and its 1-week rating is sell. Since market conditions are prone to changes, it's worth looking a bit further into the future — according to the 1-month rating CPER shows the neutral signal. See more of CPER technicals for a more comprehensive analysis.
No, CPER doesn't pay dividends to its holders.
CPER trades at a premium (18.45%).
Premium/discount to NAV expresses the difference between the ETF’s price and its NAV value. A positive percentage indicates a premium, meaning the ETF trades at a higher price than the calculated NAV. Conversely, a negative percentage indicates a discount, suggesting the ETF trades at a lower price than NAV.
Premium/discount to NAV expresses the difference between the ETF’s price and its NAV value. A positive percentage indicates a premium, meaning the ETF trades at a higher price than the calculated NAV. Conversely, a negative percentage indicates a discount, suggesting the ETF trades at a lower price than NAV.
CPER shares are issued by The Marygold Cos, Inc.
CPER follows the SummerHaven Copper (TR). ETFs usually track some benchmark seeking to replicate its performance and guide asset selection and objectives.
The fund started trading on Nov 15, 2011.
The fund's management style is passive, meaning it's aiming to replicate the performance of the underlying index by holding assets in the same proportions as the index. The goal is to match the index's returns.