Key stats
About Direxion Daily Healthcare Bull 3X Shares
Home page
Inception date
Jun 15, 2011
Structure
Open-Ended Fund
Replication method
Synthetic
Dividend treatment
Distributes
Distribution tax treatment
Ordinary income
Income tax type
Capital Gains
Max ST capital gains rate
39.60%
Max LT capital gains rate
20.00%
Primary advisor
Rafferty Asset Management LLC
Distributor
Foreside Fund Services LLC
As a levered product, CURE is not a buy-and-hold ETF, it's a short-term tactical instrument. Like many levered funds, it delivers 3x exposure only for one day. Over longer periods, returns can vary significantly from 3x of its underlying index, which covers some of the biggest healthcare nameslike J&J, Pfizer, and Merckin the space, and those heavyweights comprise a large share of CURE's cap-weighted, S&P 500-only portfolio. As a short-term product, CURE's expense ratio is less important than all in trading costs. Trading can be volatile. Check the latest Tradability data on this page.
Related funds
Classification
What's in the fund
Exposure type
Health Technology
Cash
Stock breakdown by region
Top 10 holdings

CURE price moved above its 50-day MA on June 19, 2020This price move could indicate a change in the trend, and may be a buy signal for investors. I found 46 similar cases, and 42 were successful. Based on this data, the odds of success are 90%.

Healthcare volatility could be good for swing tradersA recent survey of analysts by FactSet revealed that we're in an "earnings recession" right now and that it's expected to get worse in the next quarter. Certain sectors have been particularly hard hit, namely mining and semiconductors. The sectors that are expected to report the best earnings this q

CURE buy for the LONG (2+ years)Buying at ~53.37. taking profits at red line.
my fair value for this etf is $62 per share.


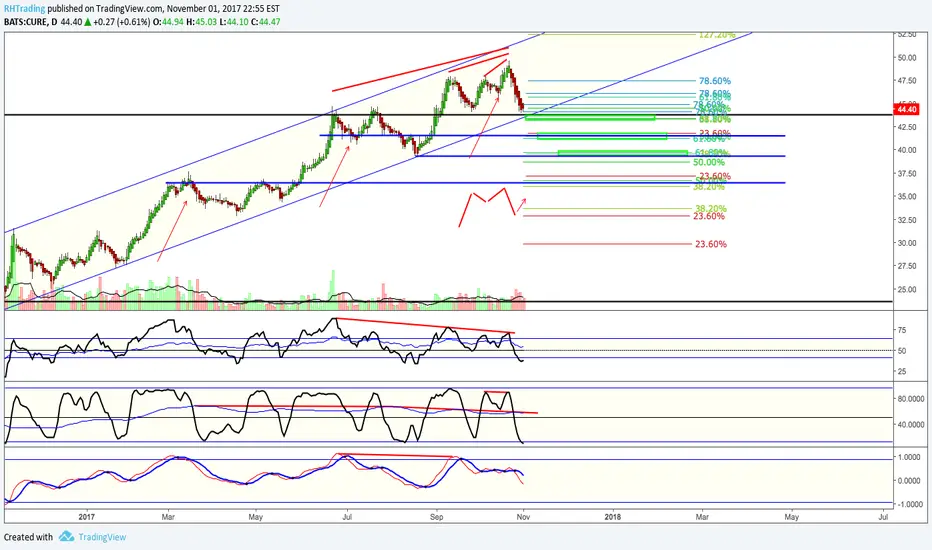
Long CURE 3:1 Reward/Risk, Risk $100 to make $300.CURE is at the bottom of the longer term trend and we have an opportunity to place a trade for continuation of the trend.
Entry (Stop Limit Buy): Stop $44.77 @ Limit $44.87 (10 cents above previous high)
Stop Loss: $43.18 (10 cents under the previous low)
Profit Target: $49.93 (3x risk)

CURE 3x ETF. Potential 3 drives + DivergenceMessy chart. Some potential buy targets through confluence support shown.

See all ideas
Summarizing what the indicators are suggesting.
Oscillators
Neutral
SellBuy
Strong sellStrong buy
Strong sellSellNeutralBuyStrong buy
Oscillators
Neutral
SellBuy
Strong sellStrong buy
Strong sellSellNeutralBuyStrong buy
Summary
Neutral
SellBuy
Strong sellStrong buy
Strong sellSellNeutralBuyStrong buy
Summary
Neutral
SellBuy
Strong sellStrong buy
Strong sellSellNeutralBuyStrong buy
Summary
Neutral
SellBuy
Strong sellStrong buy
Strong sellSellNeutralBuyStrong buy
Moving Averages
Neutral
SellBuy
Strong sellStrong buy
Strong sellSellNeutralBuyStrong buy
Moving Averages
Neutral
SellBuy
Strong sellStrong buy
Strong sellSellNeutralBuyStrong buy
Displays a symbol's price movements over previous years to identify recurring trends.
Frequently Asked Questions
An exchange-traded fund (ETF) is a collection of assets (stocks, bonds, commodities, etc.) that track an underlying index and can be bought on an exchange like individual stocks.
CURE trades at 69.31 USD today, its price has fallen −3.62% in the past 24 hours. Track more dynamics on CURE price chart.
CURE net asset value is 67.47 today — it's fallen 13.29% over the past month. NAV represents the total value of the fund's assets less liabilities and serves as a gauge of the fund's performance.
CURE assets under management is 146.85 M USD. AUM is an important metric as it reflects the fund's size and can serve as a gauge of how successful the fund is in attracting investors, which, in its turn, can influence decision-making.
CURE price has fallen by −13.09% over the last month, and its yearly performance shows a −42.41% decrease. See more dynamics on CURE price chart.
NAV returns, another gauge of an ETF dynamics, have fallen by −13.29% over the last month, showed a −14.45% decrease in three-month performance and has decreased by −42.62% in a year.
NAV returns, another gauge of an ETF dynamics, have fallen by −13.29% over the last month, showed a −14.45% decrease in three-month performance and has decreased by −42.62% in a year.
CURE fund flows account for 22.39 M USD (1 year). Many traders use this metric to get insight into investors' sentiment and evaluate whether it's time to buy or sell the fund.
Since ETFs work like an individual stock, they can be bought and sold on exchanges (e.g. NASDAQ, NYSE, EURONEXT). As it happens with stocks, you need to select a brokerage to access trading. Explore our list of available brokers to find the one to help execute your strategies. Don't forget to do your research before getting to trading. Explore ETFs metrics in our ETF screener to find a reliable opportunity.
CURE invests in stocks. See more details in our Analysis section.
CURE expense ratio is 0.93%. It's an important metric for helping traders understand the fund's operating costs relative to assets and how expensive it would be to hold the fund.
Yes, CURE is a leveraged ETF, meaning it uses borrowings or financial derivatives to magnify the performance of the underlying assets or index it follows.
In some ways, ETFs are safe investments, but in a broader sense, they're not safer than any other asset, so it's crucial to analyze a fund before investing. But if your research gives a vague answer, you can always refer to technical analysis.
Today, CURE technical analysis shows the sell rating and its 1-week rating is strong sell. Since market conditions are prone to changes, it's worth looking a bit further into the future — according to the 1-month rating CURE shows the sell signal. See more of CURE technicals for a more comprehensive analysis.
Today, CURE technical analysis shows the sell rating and its 1-week rating is strong sell. Since market conditions are prone to changes, it's worth looking a bit further into the future — according to the 1-month rating CURE shows the sell signal. See more of CURE technicals for a more comprehensive analysis.
Yes, CURE pays dividends to its holders with the dividend yield of 1.57%.
CURE trades at a premium (0.15%).
Premium/discount to NAV expresses the difference between the ETF’s price and its NAV value. A positive percentage indicates a premium, meaning the ETF trades at a higher price than the calculated NAV. Conversely, a negative percentage indicates a discount, suggesting the ETF trades at a lower price than NAV.
Premium/discount to NAV expresses the difference between the ETF’s price and its NAV value. A positive percentage indicates a premium, meaning the ETF trades at a higher price than the calculated NAV. Conversely, a negative percentage indicates a discount, suggesting the ETF trades at a lower price than NAV.
CURE shares are issued by Rafferty Asset Management LLC
CURE follows the S&P Health Care Select Sector. ETFs usually track some benchmark seeking to replicate its performance and guide asset selection and objectives.
The fund started trading on Jun 15, 2011.
The fund's management style is passive, meaning it's aiming to replicate the performance of the underlying index by holding assets in the same proportions as the index. The goal is to match the index's returns.