DIA trade ideas

DJI Wave AnalysisHere is my wave count using fib levels for the DJI (DIA). Note the candle wick making a perfect touch of 1.786 fib. I think that this week could be another down week looking to form the wave 4 of this uptrend. I marked some key support areas on the chart. If this does turn out to be a wave 4, the rule is that they rarely exceed 30% pull back of wave 3. I have also marked that on the chart.
4h
2h
Hope it helps.

buyer beware.this applies to all major indices.
we are entering 60 weeks from march 23 2020 bottom on may 17 (60 = 420 days).
this is an important cycle.... with which the significance of you can see if you go back in history. for example. go to feb 19 2020....now go back 60 weeks.....
important weekly cycles are 30, 45, 60, 90, 135, 150, 180, 210, 225, 315, 330 and 360. cycles which means circle is simply divided....

030. PIGGISH PLAY - Sell The News This WeekThis seems like a pretty blanket statement, but I believe that it will succeed regardless of the type of news being reported or whether the underlying asset in question is directly the subject.
What I mean is that if you were to sell all earnings reports prior to the announcement, it will be a net winning strategy. If you sell the major indices into the FOMC meeting, broadly speaking, it will be a net winning strategy. And most of all, if you sell a handful of stocks into the GDP estimate, it will be a net winning strategy.
To refine the blanket down to a single thread, I would say that selling a major index ETF into GDP will offer the greatest risk/reward amongst the vast array of news that is due to report this week. The reason is simple, but not terribly obvious to the new investor: the market is damned to fall either way.
Say GDP crushes estimates (cannot imagine this happening unless the numbers include the FED's asset purchases), then the first thing to react higher will be interest rates. If GDP merely beats estimates, you will see interest rates jump aggressively and immediately. Nobody is going to believe Powell's insistence on sustained easy money this time around if the growth numbers are there.
Ok, but what if GDP misses to the downside? Well, I find this hard to believe because its only a rough estimate and data seems to only come in favorably these days. But under this unlikely scenario, the obvious reaction is to sell your equity because the economy is nowhere near the point of recovery. Thus, stock valuations are not aligned with "reality", and ought to price discover accordingly. Is Powell's outcry for sustained easy money more believable in this case?
Yes it is, but who cares? Easy money is old news and has been essentially priced in perpetuity already.
My point is that it is very likely that the broader market moves considerably lower in reaction to economic data, earnings reports, and most notably, the all-important GDP estimate.
Thus, SELL the news this time around. Better yet, buy DIA PUTS as per the Pig-Specs below:
Pig-Specs:
Main Short: Buy (LONG) DIA (Dow ETF) PUTS - Strike 332, Expiration 05/07/2021
Offset: Buy (LONG) IWM (Small-Cap ETF) CALLS - Size - 1/3rd Size of Main Short, Strike 230, Expiration - 05/07/2021
If the market continues, I think the Small-Caps will benefit most poignantly, which is why I'm using IWM as an offset for this trade.
-Gross Domesticated Pig
AMEX:DIA
AMEX:IWM
AMEX:SPY
NASDAQ:QQQ
FRED:GDP

CPI will exceed 0.3% today look for a very cautious marketThe US is forecasting a 0.3% monthly CPI today, we think it will be closer to 1% for the month, given the cost of goods has dramatically increased in the US and just now being priced into the market.
Look for a return in the near term to the 50MA (332) and also the 1.27 fib at 326. A cooling the market needs to happen as companies continue to announce record profits based on a larger pool of money in the system.
Note: we hold shorts from 348-9 in this asset.

greedy blatant pumping This thing has rallied 1K points in broad daylight within a week. WTF. rolled into an at the money right at the close today. Hellish jobs report and this thing goes parabolic. IMO. '99 vibes today. I don't like this action one bit.
$DIA looking at a 5/21 put...Not sure if it will be a calendar, spread, or at the money end of day....

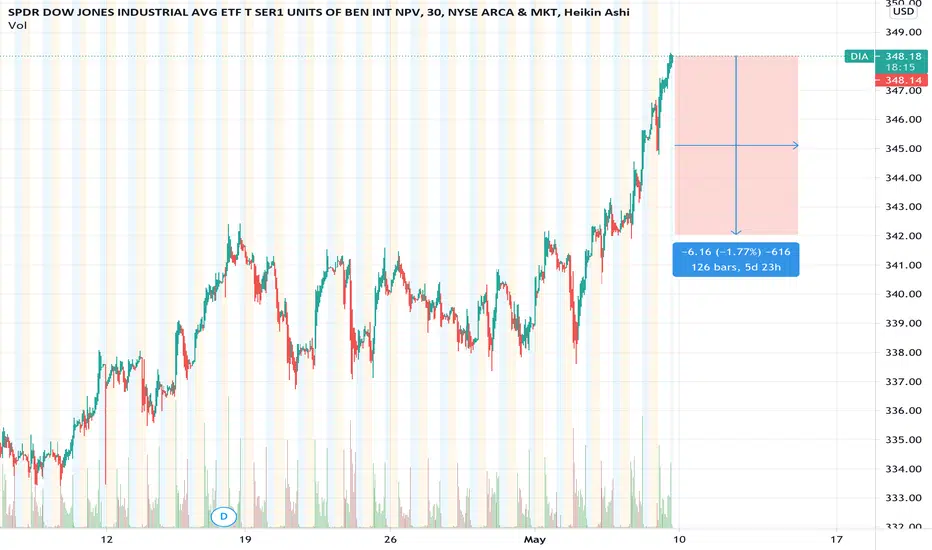
DIA Bullish TrendDIA is on the move, and it doesn't look like it'll be turning around just yet. The Heikin-Ashi candles show a clear upward trend. If that wasn't enough, MACD is now crossing into a long signal, and momentum is on the rise. Time to go long with DIA.

Give it some time and it's coming down!Massive divergence on the MFI and stock price. Give it some time, it's coming down

DIA - Calling Top Here - 1.414 Fibonacci Extension Reached Yesterday was a warning in my opinion.
Today is positioning ahead of further selling pressures.
DIA is topping out of the ascending triangle; position accordingly.
(Opinion only)


Low Volume Push On DIA, Will We Roll Over Or Head HigherSame as I put for SPY , DIA is looking a little sketchy right now. Same trend is in play as back in February when it was approaching new record levels. Low volume push higher before rolling over. Plus this week there's a fair amount of economic catalysts to factor in, on top of the first round of Q1 earnings.
This week there are plenty of economic events to take into consideration. One of the foremost things to take into consideration will be the kick-off of Q1 earnings results. The market could gain a glimpse of any progress made as vaccine distribution continues. Companies like Pepsi (NASDAQ: PEP ), Bed Bath & Beyond (NASDAQ: BBBY ), and Delta Air Lines (NYSE: DAL ) could shed some light on the temperature of the economy. This week will also bring consumer price inflation figures into focus. Tuesday, the Commerce Department delivers these at 8:30 AM ET. Inflationary fears remain a hot topic of conversation right now, even as the S&P and Dow reach new highs. This will also weave in with the numerous Federal Reserve speeches this week as discussions continue about interest rates. Thursday will also bring some attention to U.S. retail figures. The consensus forecast? Retail sales are expecting a jump of 5.5%. That would represent an increase from February’s decline of 3%, the largest dip since last April. Whether or not these events spark momentum in the stalled rally for small-cap stocks is to be seen. Looking at benchmark ETFs like the Russell 2000 Small-Cap ETF (NYSE: IWM ), it hasn’t mirrored the same trends as the broader markets. However, it has bounced back a bit from its late March lows.
Quote Source: Best Penny Stocks To Buy Right Now? 3 For This Week’s Watch List

Long | DIAAMEX:DIA
Possible Scenario: LONG
Evidence: Price Action
This is my idea and could be wrong 100%,
TP ~334
CALLS for 31 March Strike 335$


Don't Miss the DowThis is a buy high and sell higher set up. From a technical perspective, looking for RSI to get closer to 75. Looking for a stretch to 245 in the DIA etf.


DOW JONES debit spread play with good chanceI've opened a LONG CALL VERTICAL spread yesterday end of day for Dow Jones.
Correction maybe consolidated, I'm expecting some short squeeze soon.
Otherwise the probability of profit is godd, and the trade is manageable because of lower strikes.
(1) Relative Implied Volatility is low
I'm using my Relative implied volatility indicator to determine the credit/debit type of option trades.
Low relative implied volatility justifies debit option strategy (longing options) instead of creadit strategy (shorting options)
(2) Neutral RSI - no oversold or overbought
Uptrend still holding after a quick correction.
My Smooth RSI indicator is in no one's land.
There is plenty of room up and down.
(3) Observing other Down Jones instrument
Every Down Jones instrument pretty same indicator values for RSI and RIV too: DJI, YM, DJIA, DIA
CONCLUSION:
I'm using LONG CALL VERTICAL -
Buy 1 DIA April16' 305 Call Sell 1 DIA April16' 310 Call
Debit call spread for 3.92 debit
Probability of Profit: 67% Profit Target relative to my Buying Power: 26% Max profit: 105$ Max loss at expiry: 395$ (Buy Power) Max loss with my risk management: ~120$ Tasty IVR: 3.1 Expiry: 38days
Stop/my risk management: Closing immediately if daily candle is closing below $309
Take profit strategy: I'm taking at the 55% of max.profit in this case with auto sell order. (at 4.55 debit)
If you liked this article, check my other ideas.
Anyway: HIT THE LIKE BUTTON BELOW, and follow my fresh ideas ( @mrAnonymCrypto on tradingview ).


326 is the 1.27 Extension for DIAWe are in a middle ground right now for DIA. Given the stimulus plan in place (very sure that is passes as of 3/10) expect an extension to 326 for the short term.
We don't see the 1.618 extension hitting anytime soon so 326 is the extension we look for a conclusion in the current market cycle.
Anything over this is a very overbought market and needs to be corrected. We will wait for confirmation of anything else until this point.

Bull-Bear Transition Year 2000Nasdaq (Nasdaq-100 ETF: QQQ) was a strong leader prior to topping out on March 9, 2000. This is very similar to today’s market with about 100% gains from February 2020 to February 2021
Dow (ETF: DIA) and S&P (ETF: SPY) lagged behind Nasdaq during the Nasdaq rally
When Nasdaq reversed from the top to its first stage, Dow and S&P were still near the record-high area.
Three-day rebound (04/05/2000-04/07/2000), which mapped to today’s condition, was to prepare the next sell-off wave
Then, it was another 5-day strong selling (04/10/2000-04/14/2000). Notice Dow and S&P performed well during that time. It made sense to see money rotation from red-hot technology or bubble to safer stocks like financial, industrial, energy, material. Does it sound similar when you compare Tesla (TSLA) with JP-Morgan (JPM) today?
The rest story is straightforward to see bull gave its position to bears in the next 12-15 months that Nasdaq lost -80% and Dow was down -40%.

DIA short into strengthWhile the tech sector is getting crushed right now, most financials, industrials, cyclicals, and value stocks which comprise over half of the Dow Jones Index are doing well. However, if you are looking to add some negative delta to your portfolio, you could short into strength. DJI/DIA could still rally up, but the downwards market pressure is getting stronger, so selling into strength might be ideal as the concentration of buyers towards the ATH will trigger stop losses at a high velocity. The probability of a rapid rally on DJI should be slim, but a rapid pulldown is feasible at the current levels.
