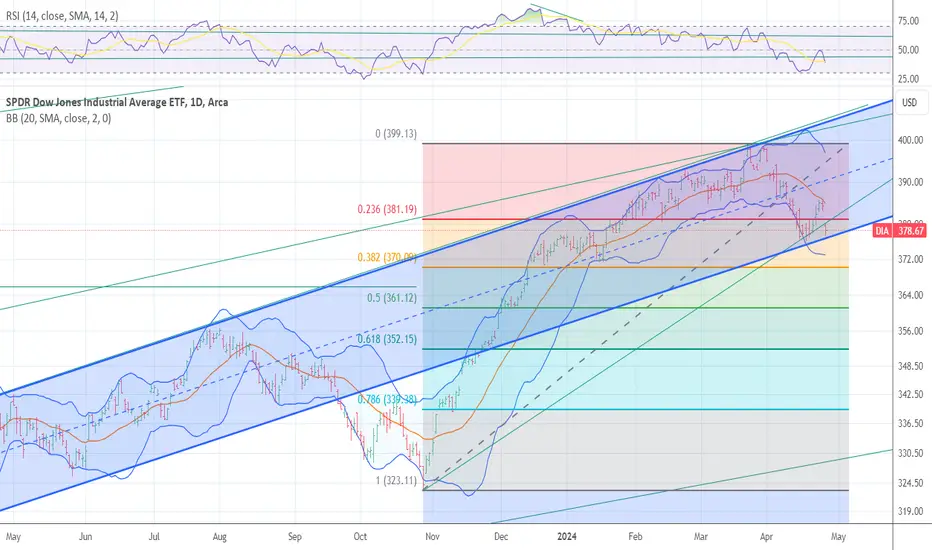
DIA support and crossroads ! The chart posted is than of a channel I believe we have been in for some time as well as fib relationship . we are now sitting a channel that should be watched and respected .
DIA trade ideas

I am long calls SPY and now TLT The chart posted is that of the DIA as I have said this chart is and has been very clear in regards to the Pattern forming . In march at the spring Equinox on the 21 we peaked above the bb bands on the monthly and also peaked just under the super cycle channel into the fib projections 39580 to 40480 right in the middle 39880 . So we have a cycle turn that goes back to oct 13 low 2022 this is due may 8 plus or minus 2.2 days . I do NOT see us breaking this channel posted NOT YET .I have posted the pattern to which I see us following .We have had two equal legs up to the tick in the spx 500 cash But the dji has formed something different . I did try to short the other day into 5120 but covered with a minor loss .35 of 1 pct and did go Long calls from 5080 25 % and had to 40 % at 5065 and then to 50 % at 5060 as the math had a target 5059 that held and then broke rather sharp and accelerated at that point sharp .I maintain my 50 % long calls and see the DECLINE still forming a wave abc for WAVE B low we should have a sharp rally in wave C up to 5146. if we break above 5146 we should see a alt min 5196 after this we would see a retest of 5264 and most likely print the final top 5330 . the 5262 peak was a perfect relationship to the 2000 peak and on the GANN day march 21 . Best of trades WAVETIMER

This is why I am taking on long calls the channel The chart posted is in a well defined channel that is parallel we are now retesting it . if we were to Break it . that would be BAD thing . But if we break it and close back above that that would be a GOOD thing .We had the Vix cycle peak come in within 1.5 days of the 4/15/4/17 and we are setting up for Moves in Both directions . Trade it this way
CYCLE LOW 4/15 4/17 golden ratio and spiral f9 4/16The chart is that of the DIA .This chart was telling me that the market was set for the decline right into the VIX cycle PEAK due 4/15/4/17 I have now moved to a bullish view that the first leg down is ending NOW and that Both wave count point to a rally to start from today and I have moved back into a 50 % net long CALLS next cycle turn is may 6th

DIA may experience a significant drop, but it won't be the endStatistically throughout history, on average, stocks drop by at least 10% at least once a year. I believe that moment may have finally arrived for DIA.

SPY - LONG (2 trades)Trying lower timeframes (1h)
First trade -
enter price -387.78
stop loss -385.42
take profit -392.50
DETAILS: the price is in an uptrend inside a tunnel , I decided to enter at the third candle after the touch at the support line of the tunnel and the touch at the strong support area.
The SL is below the ema 200 , the support line of the tunnel and there strong support area .
Second trade -
swing 10 high low strategy
enter price -391.01
stop loss -388.76
take profit -396.40
DETAILS: the price tried to break the swing 10 high (the red line) once and couldn't do it returned back below ( the red candle that I put the ellipse on ,we can see his long wick facing down , it means that there is a strong rejection of the price going down).
at the second time the price have broke the swing 10 high with a big bullish candle (the volume wasn't that strong) , now we have entered the trade.


DIA in downward trendSPDR® Dow Jones Industrial Avrg ETF Tr (DIA, $381.37) RSI Indicator left the overbought zone on January 31, 2024
This is a signal that DIA's price could be shifting from an uptrend to a downtrend. Traders may consider selling the stock or exploring put options. A.I.dvisor looked back and found 43 similar cases where DIA's RSI Indicator left the overbought zone, and in 35 of them led to a successful outcome. Odds of Success: 81%.
DIA in downward trend: price may decline as a result of having broken its higher Bollinger Band on January 22, 2024
DIA broke above its upper Bollinger Band on January 22, 2024. This could be a sign that the stock is set to drop as the stock moves back below the upper band and toward the middle band. You may want to consider selling the stock or exploring put options. The A.I.dvisor looked at 39 similar instances where the stock broke above the upper band. In 35 of the 39 cases the stock fell afterwards. This puts the odds of success at 90%.
Price Prediction Chart
Technical Analysis (Indicators)
Bearish Trend Analysis
The 10-day RSI Indicator for DIA moved out of overbought territory on January 31, 2024. This could be a bearish sign for the stock. Traders may want to consider selling the stock or buying put options. Tickeron's A.I.dvisor looked at 43 similar instances where the indicator moved out of overbought territory. In 36 of the 43 cases, the stock moved lower in the following days. This puts the odds of a move lower at 84%.
The Stochastic Oscillator demonstrated that the ticker has stayed in the overbought zone for 8 days. The longer the ticker stays in the overbought zone, the sooner a price pull-back is expected.
Following a 3-day decline, the stock is projected to fall further. Considering past instances where DIA declined for three days, the price rose further in 50 of 62 cases within the following month. The odds of a continued downward trend are 79%.
Bullish Trend Analysis
The Momentum Indicator moved above the 0 level on January 18, 2024. You may want to consider a long position or call options on DIA as a result. In 67 of 80 past instances where the momentum indicator moved above 0, the stock continued to climb. The odds of a continued upward trend are 84%.
The Moving Average Convergence Divergence (MACD) for DIA just turned positive on January 30, 2024. Looking at past instances where DIA's MACD turned positive, the stock continued to rise in 41 of 46 cases over the following month. The odds of a continued upward trend are 89%.
Following a +0.89% 3-day Advance, the price is estimated to grow further. Considering data from situations where DIA advanced for three days, in 315 of 371 cases, the price rose further within the following month. The odds of a continued upward trend are 85%.
The Aroon Indicator entered an Uptrend today. In 266 of 336 cases where DIA Aroon's Indicator entered an Uptrend, the price rose further within the following month. The odds of a continued Uptrend are 79%.

Oh noRounding top or HS? Not confirmed yet, but doesn't look pretty for the DOW. If it breaks down that trendline we will see a mayor correction. Maybe I'll buy some puts but first I want to see more bearish action. Right now is consolidating and we will see a lot of volatility these days.

DIA MAJOR TOP 377.5 to 382.7 I am now 100 % short today I have now moved to 100 % long PUTS in the money 380 puts for june 2024 Look for an event on or about jan 11 to the 18 th if the dow at anytime can reach into 38200 to 38400 I will add 15 % long puts we are now 1.8 % above the dji monthly BB BANDS market panics since 1902 to today have seen drops and beginning BEAR MARKETS from 1.4 to 3.5 % above this point as of today we hit 1.8 % PUT CALL MODELS are at july peak and Bullish SEDIMENT is now into BELL RING warning signals into a low due march 10 to the 20th . best of trades WAVETIMER

Puts DIAJust bought some put of DIA:
Exp 12/29
Strike 371
I think is going to fall very fast tomorrow or Tuesday next next. It's clear overbought.

$DIA v $IWM: Growth has the edgeLooking at the Dow Jones Industrial Average vs Russell 2000 I believe we are looking at potential strength from the later. Growth stocks continue to stay buoyant.

DIA DOW ETF ShortDIA tracking the DOW widely in an ETF format on the two hour chart had a 7% rise in the
past month which was widely followed in the investment media. I believe that it was a bull
trap. In the past week price action has been sideways while the Stochastic RSI shows
bearish divergence as does the zero lag MACD. Tradign Volumes has fallen off since
burst of buying volume in mid and late November which pushed the price up 7%.
In the past week, relative volatility has fallen off in general and now negative volatility
exceeds positive. I believe that this is a top for the time being. A short position will be
taken of 10 shares with a stop above the top at 363 The target is 342 just above the POC
line, where high liquidity and volatility will return as long positions, would pile back in there
and get a bounce or even a squeeze. This would be about a reward of 8 for a risk of 2, which
seems reasonable. I will however take a 1/3 partial at 350 where the Fibonacci retracement
comes into play. The SDOW ETF would be another way to play this idea.

Dow Jones ETF (DIA) ~ December 4H SwingAMEX:DIA chart anaylsis/mapping.
DIA ETF on relative strength compared to recent SPY/QQQ performance, indicating potential market rotation.
Trading scenarios:
Continuation rally #1 = top range of Fib.
Shallow pullback #1 = ascending trend-line (white) / ascending trend-line (green dashed) / gap fill confluence zone.
Shallow pullback #2 = gap fills / descending trend-line (light blue) / 78.6% Fib confluence zone.
Deeper pullback #1 = Golden Pocket Fib / 200MA confluence zone.
Capitulation #1 = 50% Fib / ascending trend-line (light blue).
Capitulation #2 = gap fills / 38.2% Fib confluence zone.
Capitulation #3 = gap fills / 23.6% Fib confluence zone.

dow jones is going to the moonas you can clearly see, the snake techincal indicator has crossed the tongue threshold thereby indicating an exponential upwards trend

Descending TriangleNeutral until broken with a trend in that direction.
All 3 triangles, ascending symmetrical or descending, can break up or down.
Price is at the upper line today which is resistance.
Support and resistance levels were made to be broken.
No recommendation/possible W pattern.

THE SHORT SQUEEZE BULL TRAP The chart posted is that of the DIA this is my top wave count The short squeeze .I see this as wave A up within the bear we should now see a 3 way drop back to 50 to 618 5 of this rally if not a retest near .786 from this we should see wave C up once again just past today peak . Then THE BEAR PHASE should be seen . For my view to change The IWM and RSP would have to break above the july high odds at 15 % as we hit the targets in IWM 161.8 and rsp the sp held 4107 a 500 point drop this is now wave 1 of C down we are in wave 2 up the most this should see is 4415 BUT I doubt this . The VIX is setup for a rather BIG up move

$DIA all red i.e. FTFC DOWN it is Red day(s) that triggered
Red (outside) week that triggered
Red month and red quarter.....
AMEX:DIA 2 down on the quarter and not looking good
Let's see if an 'end-of-day-rally' can bring some light to the darkness the last months of the year
For now..... FTFC DOWN

DIA (SPDR Dow Jones) - further downside likelyPrice has broken through two wedges to the downside and has also closed below the key 143 level. The momentum indicator is negative. Further downside likely.

Too much supportWe could the return of the DOW. Price is just landing on a strong support zone. Next week we could see a big, fat green candle (engulfing) and heading higher from there. I may buy a few calls on Friday, I want to see if the support holds. BTW I pulled up a 2 weeks chart for better visualization but it reads the same in a weekly chart.

THE LAST RALLY in The BEAR MARKET RALLY WAVE B TOPThe chart posted tonight is the DIA tracking share we have declined in a three wave decline and from the cycle peak due on july 26/27 into the panic cycle 55 to 62 days down from sept 23 to oct 4 focus on the 25 th of sept we should enjoy a major short squeeze event in the spy dia qqq and smh . I am working on the time spirals as well as the fib time relationships I have labeled the DIA as a diagonal and it should the old record high within or above by 2 % before the WAVE C CRASH see 1998 /1999 fractals to form from the cycle low of oct 13 1998 and oct 13th 2022 a mirror image . The 5 th of the 5 was the top into my dec8th 2021 report .

Dow Jones make or breakThe Dow Jones Industrial Average (DJIA) is currently positioned at a significant support line stemming from a bearish pattern known as a rising wedge. Yesterday, it rebounded from this support line, but it is crucial to observe a stronger upward movement to maintain its position above this level. If the DJIA breaks below this lower trend line, it will invalidate the pattern and potentially trigger a substantial market drop.
The price is currently oscillating between the support line of the trend and the 200-day moving average (MA), which lies just below it, along with the 50-day MA that is positioned above. This configuration suggests that a more pronounced price movement is imminent.
Upon analyzing the Russell 2000 index (Russel) and the Financial Select Sector SPDR Fund (XLF) — both of which are indicated as showing signs of a potential downward movement in myr other analyses — it appears that there is a higher likelihood for the DJIA to experience a significant decline in the near future.
