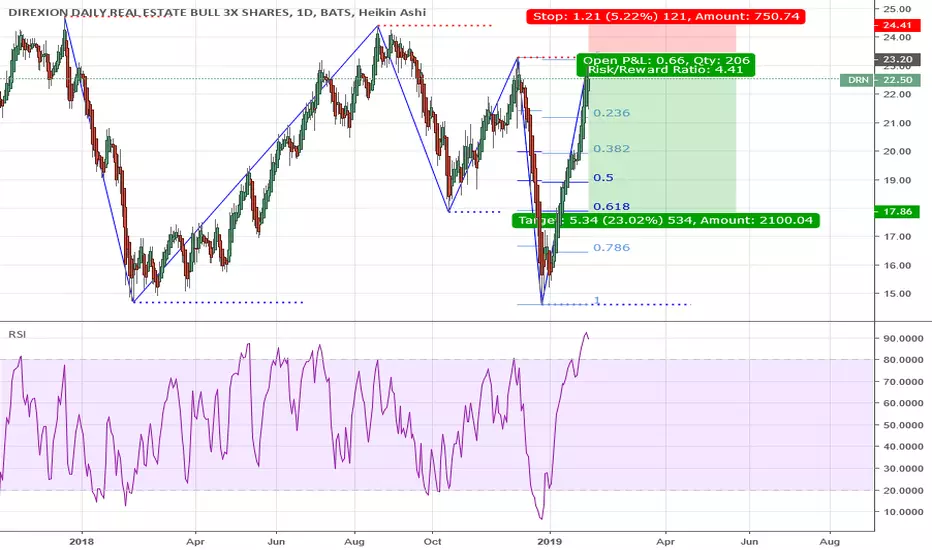
Real estate market bouncing backMy prediction on DRN is that it’s going to break out to 78 range and go on the upside to fill that imbalance.
Key stats
About Direxion Daily Real Estate Bull 3X Shares
Home page
Inception date
Jul 16, 2009
Structure
Open-Ended Fund
Replication method
Synthetic
Dividend treatment
Distributes
Distribution tax treatment
Ordinary income
Income tax type
Capital Gains
Max ST capital gains rate
39.60%
Max LT capital gains rate
20.00%
Primary advisor
Rafferty Asset Management LLC
Distributor
Foreside Fund Services LLC
DRN provides 3x leveraged exposure to the Real Estate Select Sector Index. DRN has exposure to the large-cap segment of the US Real Estate Sector as defined by GICS. The Index applies certain caps to aid diversification rules imposed on RICs. The 25/50 constraint targets of the Index are: no group entity exceeds 25% of index weight, and all group entities with weight above 5% cannot exceed 50% of the index weight. DRN is designed to be a trading vehicle not a long-term investment product. The fund rebalances daily. As a result, compounding and path dependency make its long-term returns difficult to predict when compared with its underlying index. Prior to February 28, 2022, the fund was named Direxion Daily MSCI Real Estate Bull 3X Shares, and tracked the MSCI US IMI Real Estate 25/50 Index.
Related funds
Classification
What's in the fund
Exposure type
Finance
Cash
Stock breakdown by region
Top 10 holdings

DRN possible longDouble bottom
increasing Vol
Possible T/L break
Stop out under 8.75$
first P/T 12.50$
2nd P/T 14.50$
keep an eye on real estate news see if we get any relief in the market


Ichimoku - Possible long signal for DRNNothing to get too excited about. Seems to be in a channel right now, but a crossover may be forming...however lagging span is still in the cloud


DRN Nice bullish patternexpecting a nice pull back caused by leg day, then it should rebound nicely and gains will occur!


See all ideas
Summarizing what the indicators are suggesting.
Oscillators
Neutral
SellBuy
Strong sellStrong buy
Strong sellSellNeutralBuyStrong buy
Oscillators
Neutral
SellBuy
Strong sellStrong buy
Strong sellSellNeutralBuyStrong buy
Summary
Neutral
SellBuy
Strong sellStrong buy
Strong sellSellNeutralBuyStrong buy
Summary
Neutral
SellBuy
Strong sellStrong buy
Strong sellSellNeutralBuyStrong buy
Summary
Neutral
SellBuy
Strong sellStrong buy
Strong sellSellNeutralBuyStrong buy
Moving Averages
Neutral
SellBuy
Strong sellStrong buy
Strong sellSellNeutralBuyStrong buy
Moving Averages
Neutral
SellBuy
Strong sellStrong buy
Strong sellSellNeutralBuyStrong buy
Displays a symbol's price movements over previous years to identify recurring trends.
Frequently Asked Questions
An exchange-traded fund (ETF) is a collection of assets (stocks, bonds, commodities, etc.) that track an underlying index and can be bought on an exchange like individual stocks.
DRN trades at 9.54 USD today, its price has risen 2.58% in the past 24 hours. Track more dynamics on DRN price chart.
DRN net asset value is 9.31 today — it's fallen 4.30% over the past month. NAV represents the total value of the fund's assets less liabilities and serves as a gauge of the fund's performance.
DRN assets under management is 56.74 M USD. AUM is an important metric as it reflects the fund's size and can serve as a gauge of how successful the fund is in attracting investors, which, in its turn, can influence decision-making.
DRN price has fallen by −3.05% over the last month, and its yearly performance shows a −14.52% decrease. See more dynamics on DRN price chart.
NAV returns, another gauge of an ETF dynamics, have fallen by −4.30% over the last month, showed a 0.19% increase in three-month performance and has decreased by −4.59% in a year.
NAV returns, another gauge of an ETF dynamics, have fallen by −4.30% over the last month, showed a 0.19% increase in three-month performance and has decreased by −4.59% in a year.
DRN fund flows account for −26.99 M USD (1 year). Many traders use this metric to get insight into investors' sentiment and evaluate whether it's time to buy or sell the fund.
Since ETFs work like an individual stock, they can be bought and sold on exchanges (e.g. NASDAQ, NYSE, EURONEXT). As it happens with stocks, you need to select a brokerage to access trading. Explore our list of available brokers to find the one to help execute your strategies. Don't forget to do your research before getting to trading. Explore ETFs metrics in our ETF screener to find a reliable opportunity.
DRN invests in stocks. See more details in our Analysis section.
DRN expense ratio is 0.99%. It's an important metric for helping traders understand the fund's operating costs relative to assets and how expensive it would be to hold the fund.
Yes, DRN is a leveraged ETF, meaning it uses borrowings or financial derivatives to magnify the performance of the underlying assets or index it follows.
In some ways, ETFs are safe investments, but in a broader sense, they're not safer than any other asset, so it's crucial to analyze a fund before investing. But if your research gives a vague answer, you can always refer to technical analysis.
Today, DRN technical analysis shows the sell rating and its 1-week rating is sell. Since market conditions are prone to changes, it's worth looking a bit further into the future — according to the 1-month rating DRN shows the sell signal. See more of DRN technicals for a more comprehensive analysis.
Today, DRN technical analysis shows the sell rating and its 1-week rating is sell. Since market conditions are prone to changes, it's worth looking a bit further into the future — according to the 1-month rating DRN shows the sell signal. See more of DRN technicals for a more comprehensive analysis.
Yes, DRN pays dividends to its holders with the dividend yield of 2.59%.
DRN trades at a premium (0.06%).
Premium/discount to NAV expresses the difference between the ETF’s price and its NAV value. A positive percentage indicates a premium, meaning the ETF trades at a higher price than the calculated NAV. Conversely, a negative percentage indicates a discount, suggesting the ETF trades at a lower price than NAV.
Premium/discount to NAV expresses the difference between the ETF’s price and its NAV value. A positive percentage indicates a premium, meaning the ETF trades at a higher price than the calculated NAV. Conversely, a negative percentage indicates a discount, suggesting the ETF trades at a lower price than NAV.
DRN shares are issued by Rafferty Asset Management LLC
DRN follows the S&P Real Estate Select Sector. ETFs usually track some benchmark seeking to replicate its performance and guide asset selection and objectives.
The fund started trading on Jul 16, 2009.
The fund's management style is passive, meaning it's aiming to replicate the performance of the underlying index by holding assets in the same proportions as the index. The goal is to match the index's returns.