DRV in Buy ZoneMy trading plan is very simple.
I buy or sell when at three of these events happen:
* Price tags the top or bottom of parallel channel zones
* Money flow spikes beyond it's Bollinger Bands
* Stochastic Momentum Index (SMI) at near oversold overbought level
* Price at Fibonacci levels
So...
Here's why I'm picking this symbol to do the thing.
Price in buying zone at bottom of channels
Stochastic Momentum Index (SMI) at oversold level
Money flow momentum is spiked negative and under at bottom of Bollinger Band
Entry at $23.95
Target is upper channel around $26
DRV trade ideas

SOY 2024 - DRV Monthly Seasonality StatsThe chart for DRV (Direxion Daily Real Estate Bear 3X Shares) illustrates the significant volatility and performance trends from 2015 to 2024. DRV primarily shows negative returns in the first quarter, especially in January, with large declines in 2015, 2021, and 2022. February and March often show mixed results, with some years like 2018 and 2020 displaying strong positive returns. April and May generally perform better, but DRV faces significant losses in mid-year months, particularly in June and July, which show notable declines in several years, especially during periods of macroeconomic instability. August and September demonstrate stronger returns, with DRV benefiting from broader market pullbacks during these months. October is usually volatile but shows occasional positive performance, as seen in 2021 and 2022. November and December are more favorable for DRV, with several years of positive returns, particularly in 2020, 2021, and 2023.
The DRV ETF is designed to profit from declines in the real estate sector, and its performance is closely linked to macroeconomic conditions that affect the real estate market, including the broader economic outlook and interest rate policies. A key factor currently influencing the real estate market is the Commercial Mortgage-Backed Securities (CMBS) crisis. Many banks are holding a large volume of these securities, which have lost significant value, particularly due to rising delinquency rates in office and retail spaces. The decline in the value of these securities could lead to substantial impairments on banks' balance sheets, especially for those with significant exposure to CMBS.
As the CMBS issue unfolds, DRV could become a useful tool for profiting from the potential collapse of the real estate market. As banks are forced to write down the value of their CMBS holdings and adjust their capital ratios, the real estate sector could experience increased volatility, which would benefit DRV. In addition, the high volatility in DRV could be exacerbated if CMBS delinquencies increase, particularly in office and retail properties, leading to more widespread financial instability. Investors looking to hedge against the risks in commercial real estate could find DRV an effective vehicle to capitalize on potential declines in the market.
DRV's sensitivity to real estate sector downturns makes it a valuable tool for investors tracking the risks associated with CMBS exposure, especially as the market begins to absorb the impact of increasing delinquencies and potential bankruptcies.

Inverse Real Estate DRVThe stage is set for another spike in this Inverse Real Estate ETF. 30-60% upside possible. Not trading advice.

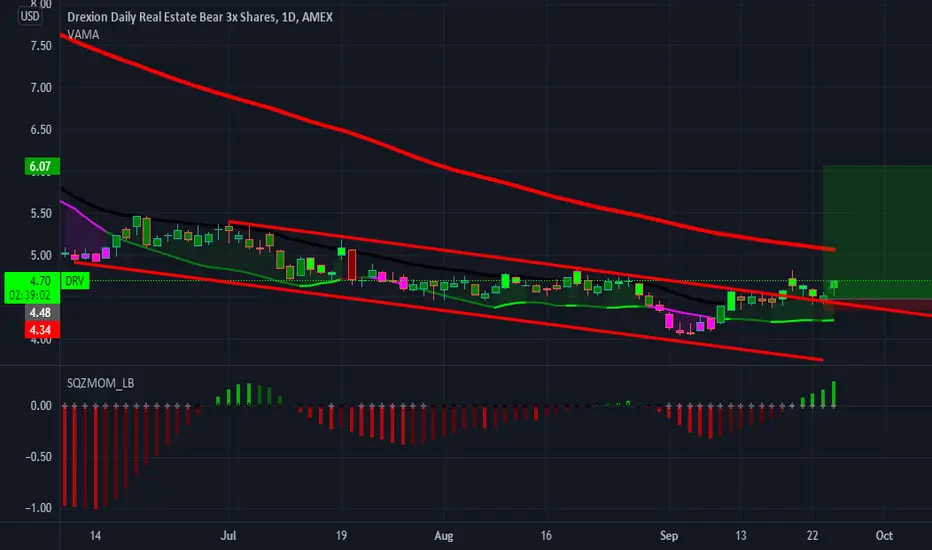
DRV a triple leveraged Real Estate ETF LONGDRV as a ETF of real estate stocks is likely somewhat responsive to the financial environment.
My idea is that the recent rate hike of 0.25% will adversely effect home sales and liquidity
especially given that the Fed has indicated that there will be on easing this year but perhaps
some pauses. They take August off for the conference and party. The 2H chart shows
price moving down from a high pivot in May. The zero-lag EMAs ( 35/70/280) are
golden crossing. The MACD confirms that upward divergence.On the dual time frame
RSI, the low TF green line has jumped up and looks solid. I will take a long swing trade
here zooming into the 15-30 minute TF for an entry. I will also look at the options chain
seeking an option expiring in 203 months reflecting a target of 48 between the POC line
of the volume profile and the mean VWAP thick black line. I like to catch revesals early to
profit from the bulk of the move. This is another opportunity.


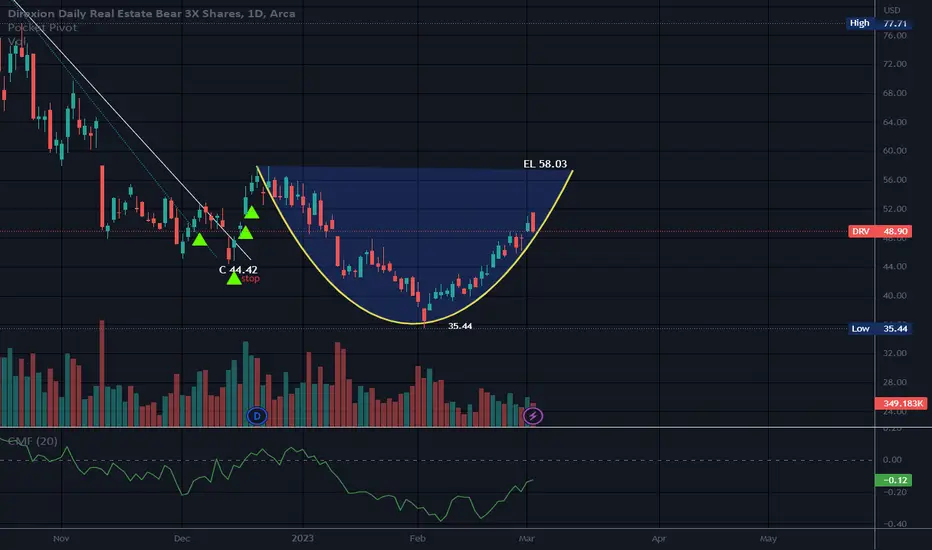
Cup and HandleThis is not to EL just yet.
This ETN is based on housing demise so if you feel housing is going up versus down, this would be a bad choice.
Leveraged.
No recommendation.
Direxion Shares ETF Trust - Direxion Daily Real Estate Bear 3X Shares is an exchange traded fund launched by Direxion Investments. The fund is managed by Rafferty Asset Management, LLC. The fund invests in public equity markets of the United States. It invests through derivatives and through other funds in stocks of companies operating across real estate, equity real estate investment trusts (reits) sectors. The fund employs short strategy and uses derivatives such as futures, swaps to create its portfolio. It invests in growth and value stocks of companies across diversified market capitalization. It seeks to track -3x the daily performance of the Real Estate Select Sector Index. Direxion Shares ETF Trust - Direxion Daily Real Estate Bear 3X Shares was formed on July 16, 2009 and is domiciled in the United States.
The investment seeks daily investment results, before fees and expenses, of 300% of the inverse of the daily performance of the Real Estate Select Sector Index. The fund invests at least 80% of its net assets (plus borrowing for investment purposes) in swap agreements, futures contracts, short positions or other financial instruments that provide inverse (opposite) or short daily exposure to the index or to ETFs that track the index. The index is provided by S&P Dow Jones Indices and includes securities of companies from the following industries: real estate management and development and REITs, excluding mortgage REITs. The fund is non-diversified. Benchmark: Real Estate Select Sector TR USD

CuppingThere is no discernible handle.
Engulfing candle today.
I will revisit this.
No recommendation.
Direxion Shares ETF Trust - Direxion Daily Real Estate Bear 3X Shares is an exchange traded fund launched by Direxion Investments. The fund is managed by Rafferty Asset Management, LLC. The fund invests in public equity markets of the United States. It invests through derivatives and through other funds in stocks of companies operating across real estate, equity real estate investment trusts (reits) sectors. The fund employs short strategy and uses derivatives such as futures, swaps to create its portfolio. It invests in growth and value stocks of companies across diversified market capitalization. It seeks to track -3x the daily performance of the Real Estate Select Sector Index. Direxion Shares ETF Trust - Direxion Daily Real Estate Bear 3X Shares was formed on July 16, 2009 and is domiciled in the United States.
The investment seeks daily investment results, before fees and expenses, of 300% of the inverse of the daily performance of the Real Estate Select Sector Index. The fund invests at least 80% of its net assets (plus borrowing for investment purposes) in swap agreements, futures contracts, short positions or other financial instruments that provide inverse (opposite) or short daily exposure to the index or to ETFs that track the index. The index is provided by S&P Dow Jones Indices and includes securities of companies from the following industries: real estate management and development and REITs, excluding mortgage REITs. The fund is non-diversified. Benchmark: Real Estate Select Sector TR USD
Continuation Wedge (Bullish) | 48% move possibleDirexion Daily Real Estate Bear 3X Shares forms bullish "Continuation Wedge" chart pattern
"Continuation Wedge (Bullish)" chart pattern formed on Direxion Daily Real Estate Bear 3X Shares (DRV:NYSE). This bullish signal indicates that the stock price may rise from the close of $40.35 to the range of $57.00 - $61.00. The pattern formed over 24 days which is roughly the period of time in which the target price range may be achieved, according to standard principles of technical analysis.
Tells Me: After a temporary interruption, the prior uptrend is set to continue.
A Continuation Wedge (Bullish) represents a temporary interruption to an uptrend, taking the shape of two converging trendlines both slanted downward against the trend. During this time the bears attempt to win over the bulls, but in the end the bulls triumph as the break above the upper trendline signals a continuation of the prior uptrend.
Price Target 1: $48
Price Target 2: $56
Price Target 3: $68
Price Target 4: $84


im forced to assume dumpsterfire in real estate still oncomparisons are telling us simply when more people are able to borrow money real estate does better. interest rate data from whale crew tells us as long as we climb this indication the risk gets worse for borrowers. as long as those go in the specified direction im looking at higher prices in this fund. all is normal as in everyone is doing fine, and still doesnt want to buy a home; snafu reit. housing market could recover i just want these metrics to go the opposite way before i call it a recovery.

ABC BullishTarget is D.
Possible stop under C.
No recommendation
Leveraged.
Direxion Shares ETF Trust - Direxion Daily Real Estate Bear 3X Shares is an exchange traded fund launched by Direxion Investments. The fund is managed by Rafferty Asset Management, LLC. The fund invests in public equity markets of the United States. It invests through derivatives and through other funds in stocks of companies operating across real estate, equity real estate investment trusts (reits) sectors. The fund employs short strategy and uses derivatives such as futures, swaps to create its portfolio. It invests in growth and value stocks of companies across diversified market capitalization. It seeks to track -3x the daily performance of the Real Estate Select Sector Index. Direxion Shares ETF Trust - Direxion Daily Real Estate Bear 3X Shares was formed on July 16, 2009 and is domiciled in the United States.
The investment seeks daily investment results, before fees and expenses, of 300% of the inverse of the daily performance of the Real Estate Select Sector Index. The fund invests in swap agreements, futures contracts, short positions or other financial instruments that, in combination, provide inverse or short leveraged exposure to the index equal to at least 80% of its net assets (plus borrowing for investment purposes). The index is provided by S&P Dow Jones Indices (the “index provider”) and includes securities of companies from the following industries: real estate management and development and REITs, excluding mortgage REITs. The fund is non-diversified. Benchmark: Real Estate Select Sector TR USD

Multiple bullish patterns on DRVLong DRV = 3x Short Real Estate. To me looks primed and ready to go in the mid term to short term. DRV has been heading downwards in this ascending channel, and it has broken to the upside of the channel. Target of that one is around 66.77. Since breaking out of that pattern it has created two smaller bullish patterns, another ascending channel, and a bull flag with shorter term target of 57.77.
I am not a professional, there are many ways to interpret charts and signals, I am only sharing what I see. Thank you.


Special Gap rules on DRV are 5/5 so far this yearBased on the 2013 publication of the Journal of Technical Analysis, first article, "Analyzing Gaps for Profitable Trading Strategies," I am noticing that you could have used these following criteria to create 5 profitable trades this year on DRV.
Look for:
A larger green candles,
red candle on day before
Green candle crosses the 10-day moving average
Above average volume
DRV is a bearish, leveraged ETF designed for shorting the U.S. Real Estate market. This might continue to yeild great trades through 2023.

DRV - Short Real Estate NowMortgage rates are penciling-in to be around 10% on a first mortgage note by Jan/Feb - so everyone with a couple of brain cells to rub together knows what that will do to real estate prices.
Some good things will come out of this - like the Gen Z's in the market will get a chance to become homeowners, but in trading terms, this is a very good opportunity. DRV is an easy ETF symbol to broadly short the real estate market with - I recommend sitting on the thing for several months.
Shorting bonds directly works, but will vary by your broker for availability.
AMEX:DRV

Daily Real Estate ETF [DRV]: 1-Month Forecast Fundamental Perspective:
In the past 50 days, the Direxion Daily Real Estate Bear 3X ETF (DRV) has experienced a surge of over 90%. As a leveraged ETF corresponding to the inverse of the Housing Market, this hardly comes as a surprise. In the past two weeks alone, the Federal Reserve raised benchmark interest rates by another 75 basis points in its ongoing struggle to curb inflation, and this has resulted in the mortgage interest rate increasing nearly 7%, adding even more pressure on potential homebuyers who are already struggling to navigate the historically high prices across the country. With 90% of mortgage holders having interest rates below 5%, not many are willing to part with a home, only to purchase a new one at an increased rate of 6.3%. Fueled mainly by this lack of supply, housing prices continue to rise in the short term, further amplifying the strain on the ever-growing housing bubble.
Technical Perspective:
From a technical standpoint, DRV is currently caught in a cross-current of two opposing channels, shown on the graph in yellow. The larger, ascending channel has been active for nearly a year, while the smaller, descending channel became active late last month when the price of DRV broke through the horizontal resistance of around $60. Examination using a custom, multi-timeframe WaveTrend indicator (coming soon) also indicates that a minor bearish divergence may playout in the second week of October, followed by a more significant bullish divergence that may push the price towards the upper portion of the ascending channel during the first few weeks of November.
Note:
The forecasted candles (shown in white) are based on lower timeframe fractals on the Heiken Ashi plot. They are intended to demonstrate one possibility of how price may interact with horizontal supports and channel boundaries in the coming month. The pivots in the projected price action have been retrofitted to be consistent with standard channel mechanics and Fibonacci spaced time intervals.

This ETF will predict the 2022 recession.Looking at the graph, we can see a very high-quality inverted head and shoulders pattern, because the second top made a way higher top than the first top. To add to that, the volume is decreasing rapidly, meaning we are very near the next bottom. This would be definitive for the ETF, because if this ETF increases in price, than the house prices would drop. This would cause a chain reaction, leading to a recession. That is why, on my last study, I said that the 2022 recession is closer than we think it is. A crisis is imminent, so be ready.
AMEX:DRV

ECONOMIC HURRICANE - Real estate 3X ETFInfamous Jaime Dimon economic hurricane for the real estate market. Inflation, recession, stagflation. You name it, houses are unaffordable for the average American.

$DRV PTs 56-100 and higher 3X Bear Real Estate ETFThe fund invests in swap agreements, futures contracts, short positions or other financial instruments that, in combination, provide inverse or short leveraged exposure to the index equal to at least 80% of its net assets (plus borrowing for investment purposes). The index is provided by S&P Dow Jones Indices (the “index provider”) and includes securities of companies from the following industries: real estate management and development and REITs, excluding mortgage REITs. The fund is non-diversified.

DRV - Long Feb 2022 $7 callsReal Estate starting to feel the pain in China as Evergrande implodes - How much longer before the contagion spreads? Weeks? Months? Clock is ticking.
DRV x3 Real Estate short ETF has a couple nice Gaps to fill at ~$12 and ~$20.
Stoch and RSI appear to be confirming a potential bottom/turn back up here on the weekly. AO also predicting a move up sooner than later.
Last few times the RSI got this low on the weekly - DRV spiked hard soon thereafter.
Adding to Feb 2022 $7 calls.
Not financial advice.


DRV reversalMy count has 5 of 5 ending recently and indicators are turning bullish. DRV shifting into reverse.
Long DRV with August 20th $6 calls.
Not financial advice.
