DUST in Buy ZoneMy trading plan is very simple.
I buy or sell when at three of these events happen:
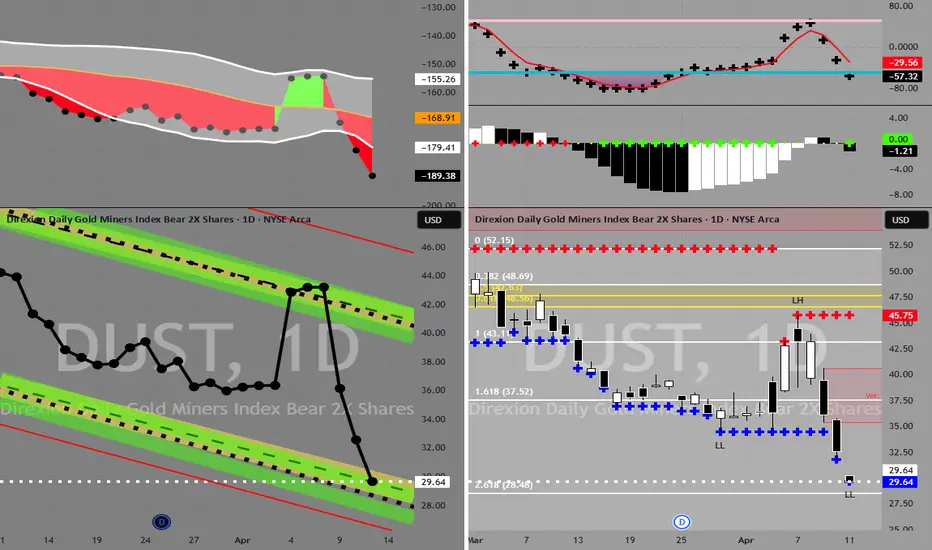
* Price tags the top or bottom of parallel channel zones
* Money flow spikes beyond it's Bollinger Bands
* Stochastic Momentum Index (SMI) at near oversold overbought level
* Price at Fibonacci levels
So...
Here's why I'm picking this symbol to do the thing.
Price in buying zone at bottom of channels
Stochastic Momentum Index (SMI) at oversold level
Money flow momentum is spiked negative and under at bottom of Bollinger Band
Price near Fibonacci level
Entry at $29.15
Target is upper channel around $36
DUST trade ideas
DUST to $54My trading plan is very simple.
I buy or sell when price tags the top or bottom of parallel channels.
I confirm when price hits Fibonacci levels.
So...
Here's why I'm picking this symbol to do the thing.
Price at bottom channels (period 100 52 & 26)
Stochastic Momentum Index (SMI) at oversold level
VBSM is spiked negative and under at bottom of Bollinger Band
Entry at $50.95
Target is $54 or channel top

38.2% marks the local top?Has AMEX:DUST reached the psychological limit for the bears sticking their neck out there to short miners?

2XBEAR MINERS LOOKING GOOD FROM HERE!It's time for precious metals to take a cooler.
I noticed JDST's options for $5 is off the chart compared to other months. I bought calls for .20 for $5 strike price in September. I anticipating these going to 2.00 by then which is 1000% return.
I also think DUST is worthy of buying at these levels too - except they don't have miners, but I see a 500% return for this stock by the fall.
I will also link to some supportive ideas following this post.

Multiple bear flags present target 7.70 necklineAMEX:DUST Gold 3x bear etf has multiple bear flags present on this chart, there's a smaller bear flag/rounding top inside the larger bear flag. In fact, there's an apex of the triangle present as well. 1hr/2hr are overbought. In addition, AMEX:DUST has failed to take out the premarket high from Yesterday, and it's failed to also recapture or retest today's intraday high. I'm short from $8.41, if gold can retest 2305-2308 that would signal a breakout and retest of NFP high of 2320.. I'm monitoring the last 15min of the close very carefully. AMEX:DUST , premarket low was 7.96, and it open at the 8.03 area. 7.70 dust price puts spot gold above 2350-2360 range...

DUST Stock Chart Fibonacci Analysis 021724Trading Idea
1) Find a FIBO slingshot
2) Check FIBO 61.80% level
3) Entry Point > 14.2/61.80%
Chart time frame : B
A) 15 min(1W-3M)
B) 1 hr(3M-6M)
C) 4 hr(6M-1year)
D) 1 day(1-3years)
Stock progress : B
A) Keep rising over 61.80% resistance
B) 61.80% resistance
C) Hit the bottom
D) Hit the top
Stocks rise as they rise from support and fall from resistance. Our goal is to find a low support point and enter. It can be referred to as buying at the pullback point. The pullback point can be found with a Fibonacci extension of 61.80%. This is a step to find entry level. 1) Find a triangle (Fibonacci Speed Fan Line) that connects the high (resistance) and low (support) points of the stock in progress, where it is continuously expressed as a Slingshot, 2) and create a Fibonacci extension level for the first rising wave from the start point of slingshot pattern.
When the current price goes over 61.80% level , that can be a good entry point, especially if the SMA 100 and 200 curves are gathered together at 61.80%, it is a very good entry point.
As a great help, tradingview provide these Fibonacci speed fan lines and extension levels with ease. So if you use the Fibonacci fan line, the extension level, and the SMA 100/200 curve well, you can find an entry point for the stock market. At least you have to enter at this low point to avoid trading failure, and if you are skilled at entering this low point, with fibonacci6180 technique, your reading skill to chart will be greatly improved.
If you want to do day trading, please set the time frame to 5 minutes or 15 minutes, and you will see many of the low point of rising stocks.
If want to prefer long term range trading, you can set the time frame to 1 hr or 1 day.


Are miners about to crash? Looks like it to meDust looks like it's putting in a bottom to me. Also, there's a big falling wedge forming.
If we see a breakout of this pattern (which I think will materialize over the next week or so), I think we'll see a sharp move higher in $DUST and miners should fall quickly.
I'd be targeting the $17 resistance level as the target. Let's see what happens over the next few weeks.

DUST Stock Chart Fibonacci Analysis 032223
1) Find a FIBO slingshot
2) Check FIBO 61.80% level
3) Entry Point > 11.6/61.80%

Buy Dust to Short gold opportunity soon?If you belive gold will correct and the dollar will go up first half of 2023.
Buying dust might be a opportunity. The setup and cyles looks nice.
I am waiting for volume and a swing low with short term avrages
and oscilators confirming the move. Also the dollar must show strength.
Last COT data must show signs that the smart money is flipping the trade.
For more simple great ideas fallow and like. I have had alot of sucsess
in markets for many years and want to share my simple approch trough
my ideas. NO BS, No selling you course and stuff like most of tradingview.
My style is based on cycles of diffrent authors, like bressert, gan and so on.
Also the investing case must have fundamentals to support it.
Lets invest not gamble.

Bearish Gold Miner ETF breaking out2x leveraged fund shorting gold miners breaking out on the weekly time frame

extended downsideIF dust loses MA10 here, after a rejection from the flat resist drawn, then a long period of downside looks highly probable.

Long $DUSTNear-term increased in USD buying power and increasing interest rates suggest a reversal in inflation coming soon. With the inverse relationship that commodities like gold share I would expect mid to long term outlook to be anti-gold.
Keeping in mind there are some market risks associated with this play. Recession potential can push out timeline or entry point. Ongoing Ukraine ware can also push out entry point.
I would tentatively build a long position with a close eye on potential recession catalysts like an escalation in Ukraine and further defaults from Evergrande.

Buy DUSTBuy from current and 14.19, stop 9.45, target 43.01
Shopping from the commercial areas of interest.
Restart position.
Stop for the maximum volume level.
The risk is 90% of the total.
Closing 50% of the position at 28.00.

bear gold miners headed into oversold territorymultiple timeframes are showing oversold stoch, rsi and negative macd for dust
19.74 a target area for bounce

Short Gold Miner Gold/Gold miner likely to top soon
Setup a trade to short the gold miner (DUST if you use etf, or short option)
Entry price today, stop loss 5-7% for DUST.
Don't get me wrong this is just a pullback which afterwards I am still Long gold/silver/miners


Buy Direxion Daily Cold MinersBuy from 23.91 and 21.39, stop 17.54, target 43.01
Limit purchases from weekly and monthly commercial interests and trending channel.

DUST Round upDUST is the inverse leveraged ETF for GOLD. GOLD looks bearish at the moment after a run up to test the resistance at the 18,500 area. This has the old breakdown support level that didn't hold and it just recently came back to up to retest that level and didn't hold. I'm projecting DUST to move up accordingly

DUST 2X ETF Trend ending Posted first on October 7th - ETF bottomed and showed significant positive side.
Swing trading yielded fair gains for a 2x ETF - posted are the gross returns
As you can see we have another rounding on the daily side and also topping trend on the WEEKLY chart.
The weekly shows prices rising almost to the breakout point
This may indicate something for gold in general or not. I will post something about that later.
Although gold investor sites always push the inflation scenario I'll believe it when I see it.
I prefer to believe it has more to do with the dollar and less with the amount of debt, but who knows?
Technically, before this event, gold was sinking and I dont see any indication of a turn around
but this causes me to take a second look. However, gold miners may be more cyclical.
I'll do another post sometime about gold in general.

DUST 2X DUST 2x Inverse ETF
I posted this about a month ago as a trading idea based on DUST bouncing and Laguerre about to turn green.
If you look at NUGT it is dropping off pretty sharply.
Buy corrections into the end of the month for (Potential) long term hold
I know the gold bugs are stuck on a continuing rise in gold with
some sort of catastrophe but I say ride it out until indicators says otherwise.

Dust - lots of gaps all the way up to the 190 areaMy gold chart work shows a low coming in Nov or early Dec. 2020. There are lots of unfilled gaps on dust and jsdt. Momentum indicator at the top is diverging
