EEM trade ideas

WEEKEND REVIEW: EEM bottom looks to be in, target above $52Hi guys, thank you for the support! I will have this analysis out each weekend as well as daily updates throughout the week, if you guys like what I'm doing hit the "follow" button and you will get a notification each time I post a video or chart!
Have a great day everyone!


Watching EEM!!Hi guys
I am watching EEM for long setup. I am watching weekly and monthly chart. I don't play this on daily . Call options are good price right now if you believe that EEM will strengthen . It went sideways as dollar ripped. I am not that convinced yet by the dollar rally and monthly chart is just showing a pullback to kijun sen. Things get interesting here. We'll see how it goes. I like USD lower still. Why is another story? Been doing by research on this and love reading about macro stuff in my free time.
Thank you for the read.


EEM vs SPY weeklyiShares MSCI Emerging Markets Index Fund vs S&P500 ETF, waiting for a breakout.... (or breakdown?)


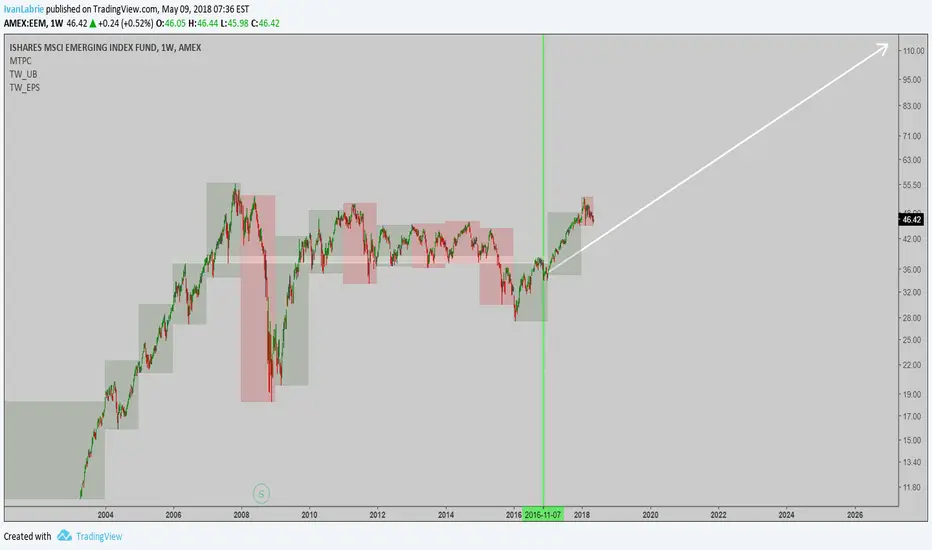
EEM: Long term long setupI'd look into allocating a long term position in emerging market stocks here, it's quite possible the dollar topped for now, and this would be an optimal place to rejoin this yearly uptrend. Long term we can see $EEM climb up over $100 easily, and it might be a safe place to keep some exposure to as a hedge for the dollar.
I also like Gold and Gold miners here, and would consider allocating some of the portfolio to them as well, together with positions in high growth exponential adoption trends like Bitcoin, EVs, Solar, Renewable energy, eto name a few.
Best of luck,
Ivan Labrie.

OPENING: EEM JUNE/SEPT 42.5/46.5/46.5/50.5 DOUBLE DIAGONAL... for an .79 credit/contract.
Roll the short straddle aspect at >25% max; look to exit for 20% of the wing width ... .

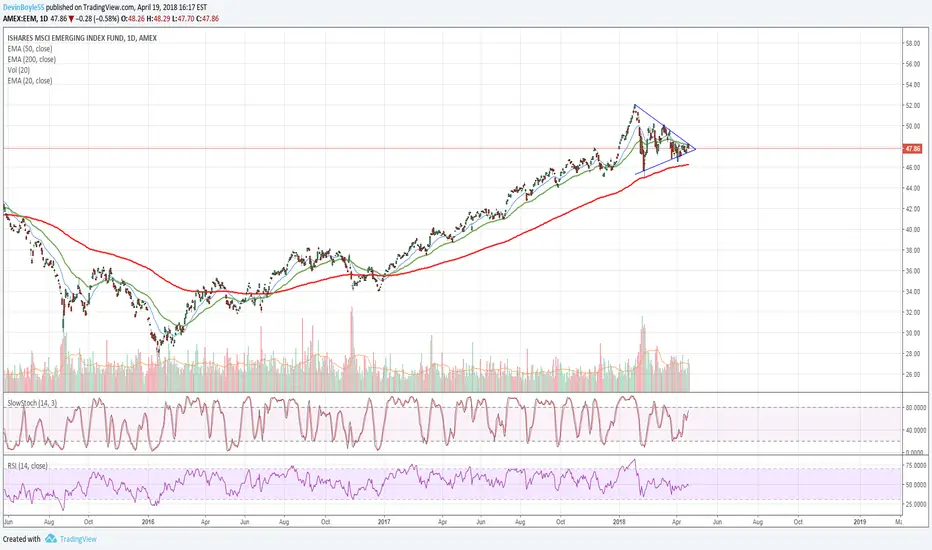
EEM symmetrical triangle breakDOWN, dropping ~3% short term
EEM has been steadily consolidating toward $48 for months, but on 5/1-5/2 broke out of that conslidation DOWNward. First price target $45 based on support/resistance and triangle area, if it breaks that then next strong support is not until ~$44.15.


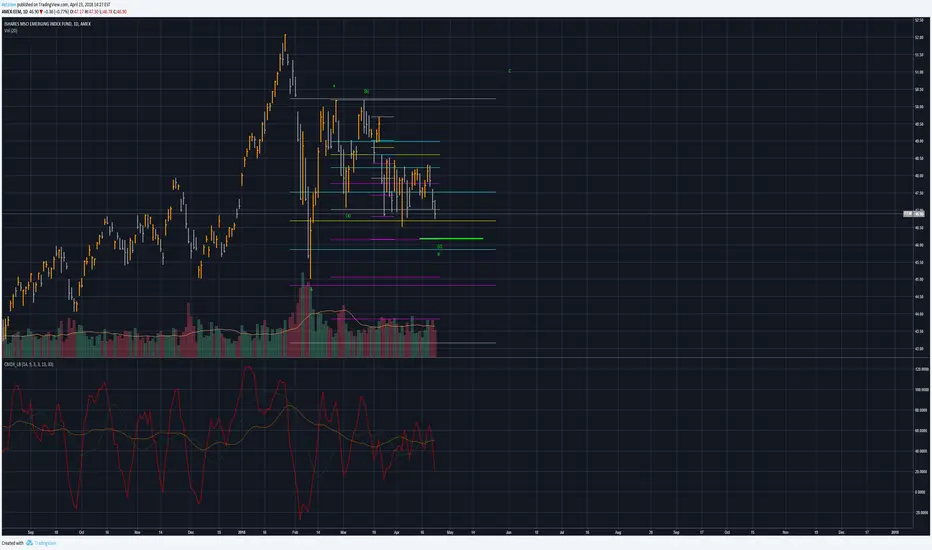
EEM Something complex is going onLooks like EM is digesting its gains from last year and is stuck in some rather ugly action. I would not do anything related to this chart until it finishes its digestion
$EEM Coiled, Ready for Breakout or Breakdown?$EEM Monitoring for a break out of long term triangle. Significant June 15 PUT buying today, could be indicator of anticipated break to the downside.
Emerging markets still poised for a long streak
With both technically showing signs of oversold, and fundamentally supported by dollar weakness. It is safe to say that emergings are still a buy.

Emerging Into Resistance Hi guys. Emerging Markets are entering a historical sell zone and with the dollar weakening maybe it's time to retest some lower levels. I hope you found this chart useful. Thank you.

Here We Go.. AFTER 2009 Emerging markets produced what ? For me emerging markets produced only loans. More debt. More Debt..
Any New Tech ? Any production ? No.
Thanks to central banks people only make more debt. Amazing.
This central banking bubble will explode but this time everyone has too big to fail debts.

EEM Breakout StrategyGood Evening! This is a brief analysis for EEM -0.31% using a 4 hour chart! Keeping it simple, we're sitting nicely in the middle of our traditional long term support and resistance. The light-green trend-line verifies that. I used an Andrew's pitchfork created with the high of 2011 and low of 2016. It's a nice long term trend analysis. We're retesting the middle support of the pitchfork a lot recently, and with how much we breakout, it's proving to not be as useful an indicator right now. still, we're sitting mostly in the pitchfork's middle S&R in 2018, so I'm optimistic we'll have a lot more harder tests of the support line. The 200 EMA has been above the 50 EMA for over a month now, but they're getting closer and could help signal that breakout. We have positive volume for the most part and the MACD is still upwardly transected, though it's path is a little flatter now. It's been a little shaky coming off our high in mid-January, but the bulls are back at it and hey they even made a flag. :) We'll be in this flag for a little while, I'll give it 20 days at the verrrrry most for us to hit breakout at $50. We'll hit $52 within 2 months and probably retest that level a few times before breaking out and hitting $53 by mid-May. It will be bloody and we're certain to retest $50 a lot before breaking out.
This has been an educational only analysis by nmholtgraves!

EEM Bearishflag BreakoutGood Evening! This is a brief analysis for EEM ! Keeping it simple, we're sitting nicely in the middle of our long term support and resistance. The trend-line verifies that. It's been a little shaky coming off our high in mid-January, but the bulls are back at it and hey they even made a flag. :) I'll give it 10 days at the verrrrry most for us to hit breakout at $50. We'll hit $52 within a month and probably retest that level a few times before breaking out and hitting $53 by mid-May.
This has been an educational only analysis by nmholtgraves!

Open EEM skewed IronCondor/capped lizard Mar16www.tradingview.com
Caught my notice as one of many stocks that popped back to begin filling yesterday's gap. The longer term trend is up.
Schaff Trend Cycle (bottom panel indicator - this is a modification of LazyBear's @LazyBear, customized line color for up/down direction and background color for Elder Ray EFI grn/red above below zero and dark green/red rising or falling) anyhow this shows cycle down from drop but background shows bounce and continuance of uptrend (to me).
Options are liquid so little cost to getting in and out of the position.
Cost: 78 credit/contract
Max P/L 78/222 upside minimum 28 profit, no loss
Spot when opened 51.11
IV rank percentile 99
Theta .44
Delta 15.9
POP: probability of making .01 or more on the trade 69%
Profit target 25. The bet here is that EEM will continue to rise, that the high IV will collapse decreasing debit/increasing profit to close the position. If it does this quickly I will grab the money and remove the risk quickly. If it drifts up, Theta decay and price will improve the position. It has some room to drift down and minimum movement would keep it in the higher profit zone (between the short strikes). This is more of a directional trade with a defined max loss so if it goes against me quickly to max loss there will be nothing to lose in waiting for it to come back. If it charges down to breakeven I will review my sentiment and if I think it has whiplashed on me to reverse down again I may close it near scratch.
So I posted the trade and now am "hung by the tongue" in that we will all see if this is profitable or not. Fun!

EEM - Swing tradeI think EEM can test all time highs 55 within the next few days. Liked that nice gap up today. Global growth here we come.

EEM - Breaking out?On the monthly the EEM is breaking out or hitting a very strong resistance. I would let it break out and pull pack to support then get in.

