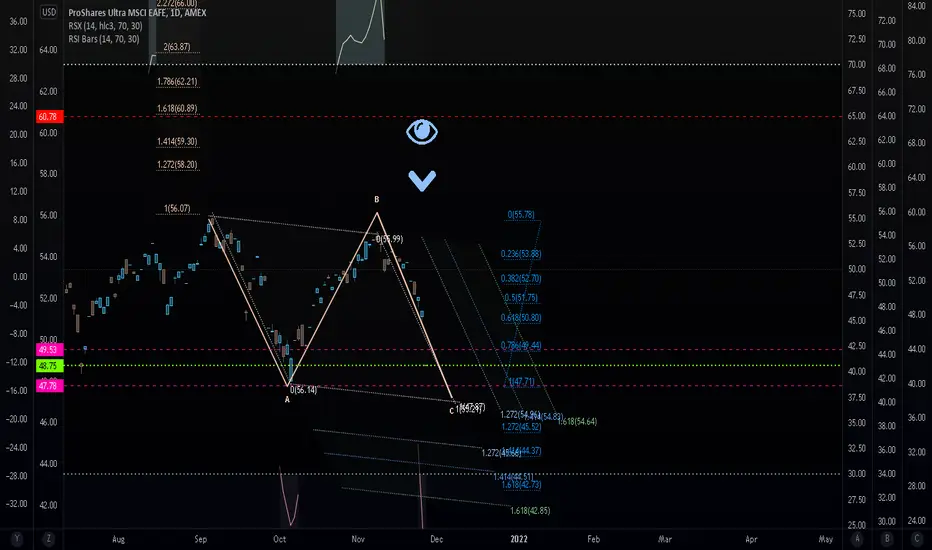
ProShare Ultra MSCI EFO dropping. EFO Another flat with Wave c underway. I have not done the subwave analysis of what is available in the latest drop, relying on Fibs to tell me where we might land if we have a truncated C or a regular flat. This developing C wave has crossed confirmation as well, so that is adding more confidence of fu
Key stats
About ProShares Ultra MSCI EAFE
Home page
Inception date
Jun 4, 2009
Structure
Open-Ended Fund
Replication method
Synthetic
Dividend treatment
Distributes
Distribution tax treatment
Ordinary income
Income tax type
Capital Gains
Max ST capital gains rate
39.60%
Max LT capital gains rate
20.00%
Primary advisor
ProShare Advisors LLC
Distributor
SEI Investments Distribution Co.
EFO provides daily 2x exposure to MSCI's popular EAFE index, which captures the developed equities market outside of the US and Canada. This is the long version of sister-fund EFU, which provides 2x inverse exposure to the same index. Simple long exposure can be had through iShares' EFA and IEFA. The fund achieves leverage through the use of swap agreements, which carry slight counterparty risk. Like all levered funds, EFO tends to underperform its target multiple in volatile markets if held for longer than its daily reset period, and is only suitable for short-term trading positions. For those who venture in, take note of the trading volume and spreads.
Related funds
Classification
What's in the fund
Exposure type
Cash
Bonds, Cash & Other100.00%
Cash100.00%
Top 10 holdings
Summarizing what the indicators are suggesting.
Oscillators
Neutral
SellBuy
Strong sellStrong buy
Strong sellSellNeutralBuyStrong buy
Oscillators
Neutral
SellBuy
Strong sellStrong buy
Strong sellSellNeutralBuyStrong buy
Summary
Neutral
SellBuy
Strong sellStrong buy
Strong sellSellNeutralBuyStrong buy
Summary
Neutral
SellBuy
Strong sellStrong buy
Strong sellSellNeutralBuyStrong buy
Summary
Neutral
SellBuy
Strong sellStrong buy
Strong sellSellNeutralBuyStrong buy
Moving Averages
Neutral
SellBuy
Strong sellStrong buy
Strong sellSellNeutralBuyStrong buy
Moving Averages
Neutral
SellBuy
Strong sellStrong buy
Strong sellSellNeutralBuyStrong buy
Displays a symbol's price movements over previous years to identify recurring trends.
Frequently Asked Questions
An exchange-traded fund (ETF) is a collection of assets (stocks, bonds, commodities, etc.) that track an underlying index and can be bought on an exchange like individual stocks.
EFO trades at 56.46 USD today, its price has risen 1.37% in the past 24 hours. Track more dynamics on EFO price chart.
EFO net asset value is 56.54 today — it's risen 2.85% over the past month. NAV represents the total value of the fund's assets less liabilities and serves as a gauge of the fund's performance.
EFO assets under management is 19.22 M USD. AUM is an important metric as it reflects the fund's size and can serve as a gauge of how successful the fund is in attracting investors, which, in its turn, can influence decision-making.
EFO price has risen by 2.72% over the last month, and its yearly performance shows a 18.36% increase. See more dynamics on EFO price chart.
NAV returns, another gauge of an ETF dynamics, have risen by 2.85% over the last month, showed a 32.37% increase in three-month performance and has increased by 22.64% in a year.
NAV returns, another gauge of an ETF dynamics, have risen by 2.85% over the last month, showed a 32.37% increase in three-month performance and has increased by 22.64% in a year.
EFO fund flows account for 7.65 M USD (1 year). Many traders use this metric to get insight into investors' sentiment and evaluate whether it's time to buy or sell the fund.
Since ETFs work like an individual stock, they can be bought and sold on exchanges (e.g. NASDAQ, NYSE, EURONEXT). As it happens with stocks, you need to select a brokerage to access trading. Explore our list of available brokers to find the one to help execute your strategies. Don't forget to do your research before getting to trading. Explore ETFs metrics in our ETF screener to find a reliable opportunity.
EFO invests in cash. See more details in our Analysis section.
EFO expense ratio is 0.95%. It's an important metric for helping traders understand the fund's operating costs relative to assets and how expensive it would be to hold the fund.
Yes, EFO is a leveraged ETF, meaning it uses borrowings or financial derivatives to magnify the performance of the underlying assets or index it follows.
In some ways, ETFs are safe investments, but in a broader sense, they're not safer than any other asset, so it's crucial to analyze a fund before investing. But if your research gives a vague answer, you can always refer to technical analysis.
Today, EFO technical analysis shows the strong buy rating and its 1-week rating is buy. Since market conditions are prone to changes, it's worth looking a bit further into the future — according to the 1-month rating EFO shows the buy signal. See more of EFO technicals for a more comprehensive analysis.
Today, EFO technical analysis shows the strong buy rating and its 1-week rating is buy. Since market conditions are prone to changes, it's worth looking a bit further into the future — according to the 1-month rating EFO shows the buy signal. See more of EFO technicals for a more comprehensive analysis.
Yes, EFO pays dividends to its holders with the dividend yield of 1.57%.
EFO trades at a premium (0.03%).
Premium/discount to NAV expresses the difference between the ETF’s price and its NAV value. A positive percentage indicates a premium, meaning the ETF trades at a higher price than the calculated NAV. Conversely, a negative percentage indicates a discount, suggesting the ETF trades at a lower price than NAV.
Premium/discount to NAV expresses the difference between the ETF’s price and its NAV value. A positive percentage indicates a premium, meaning the ETF trades at a higher price than the calculated NAV. Conversely, a negative percentage indicates a discount, suggesting the ETF trades at a lower price than NAV.
EFO shares are issued by ProShare Advisors LLC
EFO follows the MSCI EAFE. ETFs usually track some benchmark seeking to replicate its performance and guide asset selection and objectives.
The fund started trading on Jun 4, 2009.
The fund's management style is passive, meaning it's aiming to replicate the performance of the underlying index by holding assets in the same proportions as the index. The goal is to match the index's returns.