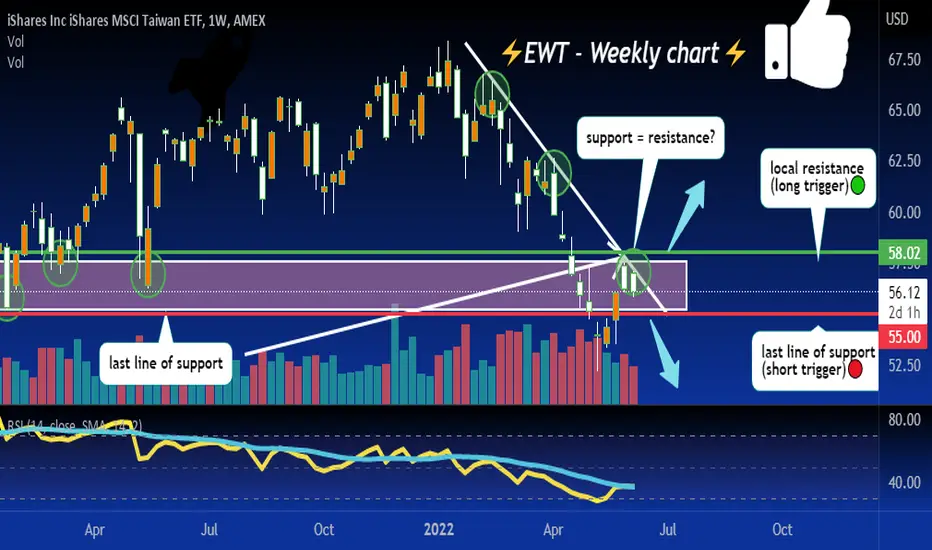
cluster resistance, not a good place to long! 🔴below local/trend resistance and recent support acting as resistance for now, not a good sign for longs.
Watching for longs above 58.02, shorts below 55
Key stats
About iShares Inc iShares MSCI Taiwan ETF
Home page
Inception date
Jun 20, 2000
Structure
Open-Ended Fund
Replication method
Physical
Dividend treatment
Distributes
Distribution tax treatment
Ordinary income
Income tax type
Capital Gains
Max ST capital gains rate
39.60%
Max LT capital gains rate
20.00%
Primary advisor
BlackRock Fund Advisors
Distributor
BlackRock Investments LLC
EWT tracks an index that includes large- and midcap stocks, covering 85% of broad Taiwanese companies by market cap. EWT changed its name from iShares MSCI Taiwan ETF to iShares MSCI Taiwan Capped ETF on Dec. 1, 2016. It changed its underlying index from MSCI Taiwan Index to MSCI Taiwan 25/50 Index. The new index has explicit diversification requirements which may impact the weights of EWT`s top holdings. The capping methodology aims to limit the weight of any single issuer to a maximum of 25% of the Underlying Index. Additionally, individual issuers that constitute more than 5% of the weight of the Underlying Index cannot exceed a maximum of 50% of the weight of the Underlying Index in the aggregate.
Related funds
Classification
What's in the fund
Exposure type
Electronic Technology
Finance
Stock breakdown by region
Top 10 holdings
ALL INDEX HAVE CONFIRMED A MAJOR TOP WORLDWIDE I have moved in puts across all indexes a banking event jan 26


EWT - Taiwan getting rektWas wondering why Asia looks like crap tonight, Taiwan is getting rekt.... down over 5%
Keep an eye on EWT, this may wind up on my trade list


EWT - bullish Taiwan I might be being a bit over-optimistic here as always you can find a count that fits a more bearish direction if you look for it. I like this one however for now but I am still curious if, when and where we are going to see a decent wave 2 correction/pullback before it continues higher. Since the "

Money Wave Buy soon on Taiwan Fund (EWTMoney Wave Buy Signal on EWT when the Stochastic Closes > 20.
stockcharts.com


See all ideas
Summarizing what the indicators are suggesting.
Oscillators
Neutral
SellBuy
Strong sellStrong buy
Strong sellSellNeutralBuyStrong buy
Oscillators
Neutral
SellBuy
Strong sellStrong buy
Strong sellSellNeutralBuyStrong buy
Summary
Neutral
SellBuy
Strong sellStrong buy
Strong sellSellNeutralBuyStrong buy
Summary
Neutral
SellBuy
Strong sellStrong buy
Strong sellSellNeutralBuyStrong buy
Summary
Neutral
SellBuy
Strong sellStrong buy
Strong sellSellNeutralBuyStrong buy
Moving Averages
Neutral
SellBuy
Strong sellStrong buy
Strong sellSellNeutralBuyStrong buy
Moving Averages
Neutral
SellBuy
Strong sellStrong buy
Strong sellSellNeutralBuyStrong buy
Displays a symbol's price movements over previous years to identify recurring trends.
Frequently Asked Questions
An exchange-traded fund (ETF) is a collection of assets (stocks, bonds, commodities, etc.) that track an underlying index and can be bought on an exchange like individual stocks.
EWT trades at 58.39 USD today, its price has risen 0.05% in the past 24 hours. Track more dynamics on EWT price chart.
EWT net asset value is 58.28 today — it's risen 0.91% over the past month. NAV represents the total value of the fund's assets less liabilities and serves as a gauge of the fund's performance.
EWT assets under management is 6.18 B USD. AUM is an important metric as it reflects the fund's size and can serve as a gauge of how successful the fund is in attracting investors, which, in its turn, can influence decision-making.
EWT price has risen by 0.88% over the last month, and its yearly performance shows a 10.86% increase. See more dynamics on EWT price chart.
NAV returns, another gauge of an ETF dynamics, have risen by 0.91% over the last month, showed a 16.51% increase in three-month performance and has increased by 13.65% in a year.
NAV returns, another gauge of an ETF dynamics, have risen by 0.91% over the last month, showed a 16.51% increase in three-month performance and has increased by 13.65% in a year.
EWT fund flows account for 511.50 M USD (1 year). Many traders use this metric to get insight into investors' sentiment and evaluate whether it's time to buy or sell the fund.
Since ETFs work like an individual stock, they can be bought and sold on exchanges (e.g. NASDAQ, NYSE, EURONEXT). As it happens with stocks, you need to select a brokerage to access trading. Explore our list of available brokers to find the one to help execute your strategies. Don't forget to do your research before getting to trading. Explore ETFs metrics in our ETF screener to find a reliable opportunity.
EWT invests in stocks. See more details in our Analysis section.
EWT expense ratio is 0.59%. It's an important metric for helping traders understand the fund's operating costs relative to assets and how expensive it would be to hold the fund.
No, EWT isn't leveraged, meaning it doesn't use borrowings or financial derivatives to magnify the performance of the underlying assets or index it follows.
In some ways, ETFs are safe investments, but in a broader sense, they're not safer than any other asset, so it's crucial to analyze a fund before investing. But if your research gives a vague answer, you can always refer to technical analysis.
Today, EWT technical analysis shows the buy rating and its 1-week rating is buy. Since market conditions are prone to changes, it's worth looking a bit further into the future — according to the 1-month rating EWT shows the buy signal. See more of EWT technicals for a more comprehensive analysis.
Today, EWT technical analysis shows the buy rating and its 1-week rating is buy. Since market conditions are prone to changes, it's worth looking a bit further into the future — according to the 1-month rating EWT shows the buy signal. See more of EWT technicals for a more comprehensive analysis.
Yes, EWT pays dividends to its holders with the dividend yield of 2.07%.
EWT trades at a premium (0.19%).
Premium/discount to NAV expresses the difference between the ETF’s price and its NAV value. A positive percentage indicates a premium, meaning the ETF trades at a higher price than the calculated NAV. Conversely, a negative percentage indicates a discount, suggesting the ETF trades at a lower price than NAV.
Premium/discount to NAV expresses the difference between the ETF’s price and its NAV value. A positive percentage indicates a premium, meaning the ETF trades at a higher price than the calculated NAV. Conversely, a negative percentage indicates a discount, suggesting the ETF trades at a lower price than NAV.
EWT shares are issued by BlackRock, Inc.
EWT follows the MSCI Taiwan 25-50 Index. ETFs usually track some benchmark seeking to replicate its performance and guide asset selection and objectives.
The fund started trading on Jun 20, 2000.
The fund's management style is passive, meaning it's aiming to replicate the performance of the underlying index by holding assets in the same proportions as the index. The goal is to match the index's returns.