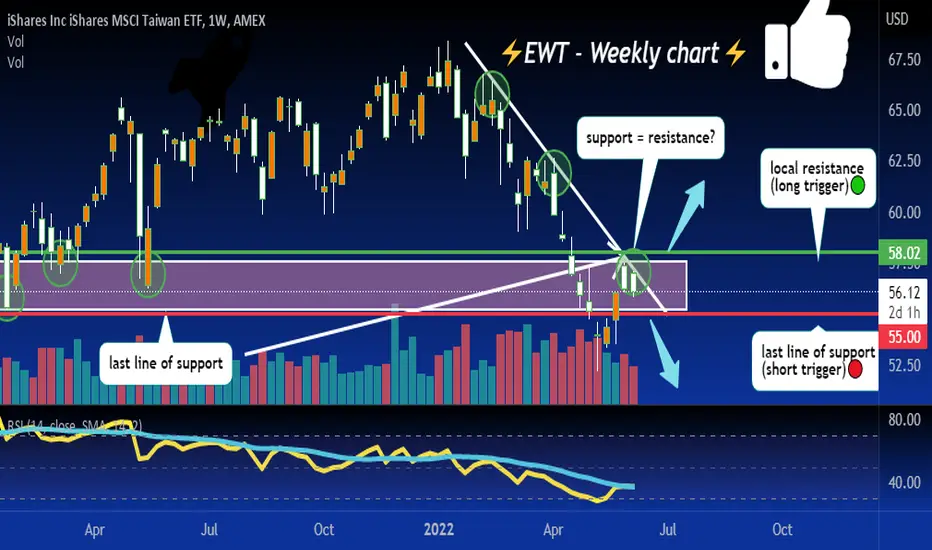
cluster resistance, not a good place to long! 🔴below local/trend resistance and recent support acting as resistance for now, not a good sign for longs.
Watching for longs above 58.02, shorts below 55
EWT trade ideas
ALL INDEX HAVE CONFIRMED A MAJOR TOP WORLDWIDE I have moved in puts across all indexes a banking event jan 26


EWT - Taiwan getting rektWas wondering why Asia looks like crap tonight, Taiwan is getting rekt.... down over 5%
Keep an eye on EWT, this may wind up on my trade list


EWT - bullish Taiwan I might be being a bit over-optimistic here as always you can find a count that fits a more bearish direction if you look for it. I like this one however for now but I am still curious if, when and where we are going to see a decent wave 2 correction/pullback before it continues higher. Since the "crash" in February, it, along with many other indexes has been heading up in an almost straight line......

Money Wave Buy soon on Taiwan Fund (EWTMoney Wave Buy Signal on EWT when the Stochastic Closes > 20.
stockcharts.com


Short Taiwan EWTTaiwan's fate is intertwined with China's. China is tightening liquidity in the country to try and temper inflation. This should reverberate through the rest of the world over the next month or so. Taiwan looks technical week on a daily and monthly basis.

"iShares MSCI Taiwan ETF forms bearish "Symmetrical Continuation
Detected a "Symmetrical Continuation Triangle (Bearish)" chart pattern formed on iShares MSCI Taiwan ETF (EWT:NYSE). This bearish signal indicates that the stock price may fall from the close of $13.21 to the range of $12.70 - $12.80. The pattern formed over 15 days which is roughly the period of time in which the target price range may be achieved, according to standard principles of technical analysis.
Tells Me: The price has broken downward out of a consolidation period, suggesting a continuation of the prior downtrend. A Symmetrical Continuation Triangle (Bearish) shows two converging trendlines as prices reach lower highs and higher lows. Volume diminishes as the price swings back and forth between an increasingly narrow range reflecting uncertainty in the market direction. Then well before the triangle reaches its apex, the price breaks down below the lower trendline with a noticeable increase in volume, confirming the pattern as a continuation of the prior downtrend.
This bearish pattern can be seen on the following chart."


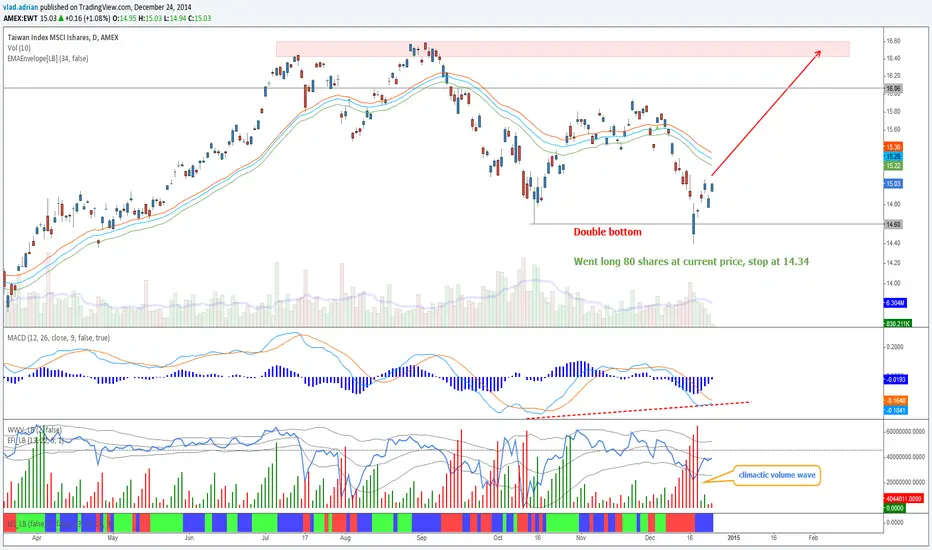
Taiwan - Double bottomThe weekly chart here That is a very bullish chart.
The daily double bottom should confirm the weekly chart very soon, which is still red at the moment. I am looking at least for the top on this trade.
Taiwan stock market - Green green tradeThe weekly chart shows a bullish Taiwanese stock market
On the daily chart, we see this ETF consolidating after breaking and retesting the Double top neckline. The histogram divergence is over, and the impulse is green. I am looking for the top.
