FNGU trade ideas

buy the dip setup.nothing else to say, market is currently a BTFD setup.
Tradingview requires i type more. Its ta, keep it ez

ABC Bullish/TECS is also ABC/DLeveraged and Volatile.
This also measures out to be a Cypher if the final leg of the M pattern does not go too far below D, which is also C of the ABC Bullish pattern.
Cypher pattern is in yellow and shares the 1st leg with the ABC Pattern. Target for the ABC pattern would be D.
MicroSectors FANG+ Index -3X Inverse Leveraged ETNs due January 8, 2038 is an exchange traded note launched by Bank of Montreal. The note seeks to track -3x of the daily performance of the NYSE FANG+ Index, total return. The index comprises of public equity markets of the United States. It takes short positions and uses derivatives to include the stocks of companies operating in the technology and consumer discretionary sectors. The index comprises of growth stocks of companies across diversified market capitalizations. The ETN will mature on January 8, 2038. MicroSectors FANG+ Index -3X Inverse Leveraged ETNs due January 8, 2038 was formed on January 22, 2018 and is domiciled in the United States.
No recommendation/Long with good entry level. Sometimes looking at candles can help. I do not see a pocket pivot at C/D.
Stop below C.

Falling WedgeLeveraged ETN x 3.
Volatile and not intended to be held long term as fees can be high.
A falling wedge converges at the apex as the down sloping trendlines narrow.
Considered bullish when price breaks the upper line with an uptrend.
No recommendation/best to buy on market UP days and this ETN is very risky.
Basically this ETN is shorting these holdings:
Top 10 Holdings (100.00% of Total Assets)
Alibaba Group Holding Ltd ADR BABA 10.00%
Alphabet Inc A GOOGL 10.00%
Amazon.com Inc AMZN 10.00%
Apple Inc AAPL 10.00%
Baidu Inc ADR BIDU 10.00%
Facebook Inc A FB 10.00%
Netflix Inc NFLX 10.00%
NVIDIA Corp NVDA 10.00%
Tesla Inc TSLA 10.00%
Twitter Inc TWTR 10.00%

FNGD TRADE SETUP Buy area is around $47, Sell area is around $61
Remember, FNGD is an inverse, so you're expecting the market to drop 10% with an investment in FNGD.

GDXU leveraged gold miner ETF LONG SETUPAMEX:GDXU
As illustrated on the one-hour chart GDXU has reversed a downtrend as indicated
by the EMA crossover and so on. Support and Resistance lines are shown.
Price is well below the SMA200 and thus undervalued as compared with historical data.
I see this as an upside 30 % long setup with reasonable risk. Once the trade
progresses perhaps 10-12% in price rise, the stop loss can be moved up to
break even. This can be approached with intermediate-term call options
as well. Targets and stop loss are marked out.

BMO 3x Return Tech ETN Set Up for a 250% RallyThere is a Bullish Piercing Line Reversal Pattern on the Monthly Timeframe as well as many instances of Bullish Divergence on The Daily Timeframe so i will be buying shares here and targetting the Daily Gap/200 day Moving Average above.

FNGU Possibly BottomedLove the look, at the golden fib, volume capitulation wick, weekly RSI at 2018 levels and I think tech bottomed, send it!

FAANG met H&S target@0.786; Earnings week scenariosFAANG reached its H&S target move exactly at the 0.786 Fib Retracement level around12.50. This is also
The bottom of my slanted pink FIB CHANNEL.
Most of the stocks in FAANG are still profit machines despite rising rates & inflation, maybe except FB & Netflix which recently pulled FAANG down a lot. If earnings come out A LOT BETTER than analysts’ projections, this 12.50 level may already be very much near the bottom of wave 4. Then wave 5 starts with
the different impt FIB levels on the chart as TP areas until the H&S neckline. Wave 5 may peaked sometime in 2023 before a potential recession.
But if earnings disappoint, we may see lower prices in the green box around 9.25 which is also FIB 0.854 level. From there a consolidation follows until it bounce from the bottom of grey slanted FIB CHANNEL.
Not trading advice


#OILU $OILU same chart with looking mighty great return as always momentum in play , but this rise better then usual

FAANG: using FRACTAL to predict wave 5.Volatility ahead in 2022FAANG FNGU stocks still have upside once this recent wave 4 correction ends. Most FAANG components will still have big earning potentials in 2022. With some like Netflix & Fb already making big enough corrections, others may see a lot of volatility in 2022 with end of QE & multiple raid hikes coming. However, stocks in general rises together with treasury yields TNX. Watch TLT bonds & gold carefully to see if a rotation to safe haven happens.
I copied the fractal of previous wave 5 of a smaller Elliott cycle to see how FAANG stocks may
behave in 2022. I think a lot of volatility is coming & a lot of weak hands will be shaken out before wave 5.
Not trading advice…just my opinion.

Long here for meI went long this morning based on my VIX and other Indexes Indicators.
Let's see how this works out. I am also long TQQQ this am.
I am nimble though and will reverse my position if my TA tells me to.
Not a financial advisor - just posting my ideas. Have your own plan and do your own due diligence.
Success and Money is not made with one trade however a good strategy.

[etf] 3X FANG ETF - FNGU - Value pricing for ETFs?FNGU is at a great value for potential swings? We will see? Use of Pullback Alerts is recommended. Edutainment Purposes Only!

NRGU Is she ready to start back up again?We might as well have all the bad new at once. So tomorrow we will see what opec is going to do on output levels. After that is there anything else left? Fear gauge at 22 and that's extreme, but I have seen it at 2 and 3 levels. So, check this out just an idea I had.

Correction coming soon for NRGU 3x leveraged ETNNRGU not yet topping out but it will be soon.
After reaching target price300, it may retrace
FIBO 38% or 50% to its strong support around 260 or 220 (See GANN Fan line).
I may be wrong coz of demand & supply
tailwind... vast demand & supply problems.
Pls make own analysis.

FAANG stocks coming back into playWith the economy looking like everyone is staying at home, the FAANG stocks will come back. Looking like a parabolic move like what happened in 2020 after the March crash.
MACD starting to turn. Osscilator showing a buy. Nice price to get into in the highlighted purple section
Been trading sideways since Januray of last year.

Tech heavy ETF with double bottomThis is the chart for BULZ tech heavy ETF.
it formed a double bottom and is busting through this resistance level like butter. The tech stocks have taken a beating but i believe the bulls are coming back stronger.
Would be wise to start a position soon

FNGU barely holding Up Channel with no definite directionIn this weekly chart,Faang stocks etf completed a bearish W-pattern & fell & now consolidating around the W-neck area 33 to 37 undecided where to go. TNX rates are going higher which puts pressure on growth stocks like XLK FAANG stocks, SMH while some money seems to be rotating to value stocks like DIA, IWM & IYT.
The good thing is Metaverse is here to stay so many of FAANG components will benefit like FB, MSFT, NVDA.
That may be the reason why FNGU is still fighting to hold its up-channel. Failure to hold 33 will see next supports at 28 & 24.
A lot of money has been pouring into FNGU since Nov of 2019 as seen in the big green Money Floe Index inside market cipher. If 33 holds, there is still room for wave 3 to run.

FNGU going Sideway?Where's FNGU going?
Chart has shown down trend showing Lower Lows and Lower High.
However it broke that trend on Dec 23 and been going side way.
If price break above $40, I'm going Long
If price break below $36.6 I'm going Short, (buy SPXS)

[ETF] Microsectors FANG 3X Index - FANGU - ready to swing?FANGU may be ready to swing upwards after double bottom pattern. We will see? Edutainment Purposes Only!

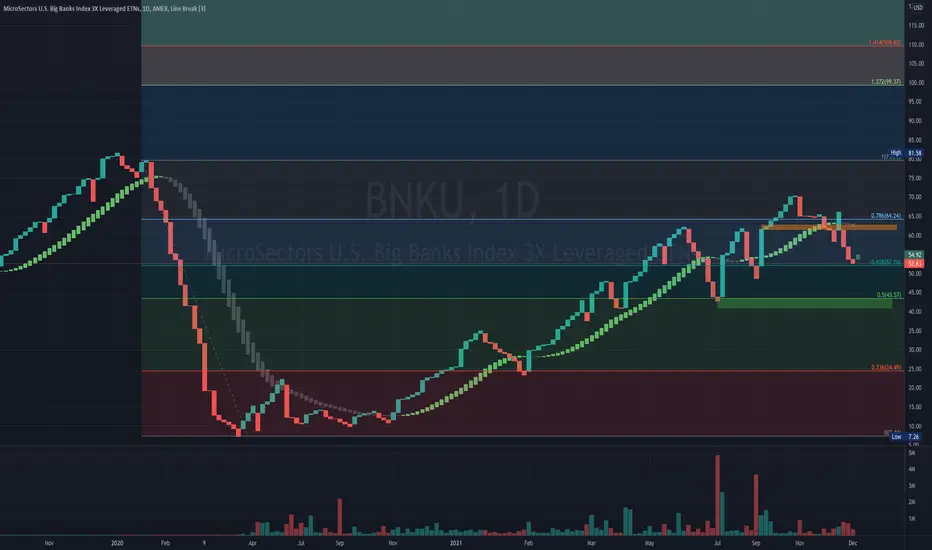
BNKUAMEX:BNKU
Currently at key lvl with possible upside towards the next fib lvls.
the lower fib lvls as support zones
currently at demand zone. can go towards the supply zone above
$FNGD easy defense play based on indicators and also general market it contains a visual clue were we were and heading next
