Daily FXI not as bullish as the Weekly/Monthly.We ended last week with a gravestone Doji that bounced off the 100. Bulls need it to close above the 34.18 point. The MACD looks good for this. However, we are very oversold. If the 100 ends up being resistance, I would watch for a pullback to 30.70 which is a very strong weekly support line and the 50SMA is sitting there as well. If it were to fall below there, the Monthly have a very strong support at 28.00.
FXI trade ideas

Bullish Setup on FXI Weeklys, watch for confirmation at 34.18Last week we broke thru a descending trend line with a bullish candle. We have a very strong weekly support at 30.79. If we can get a close above 34.25 or so, there is a gap to fill at 35.18 then things will point to the 200 at 38.02.

Monthly Chart for FXI looking Good for the Bulls....We bounced off a Long Term Support in February with a Morning Star Doji and so far in March it has been very nicely confirmed. We are oversold but turning up, and we are getting close to a MACD Crossover. We are approaching resistance at around 34.11. I'm looking for it to push up thru to 38.50ish where the 50, 200 and 21 EMA are all gathered. Will watch the weekly's and daily charts.


FXI bearish-Weakens to retest 38.88 - July’s spike low nextFXI looks to retest July’s spike low at 38.88 which is also near the 200 week moving average currently at 38.69. Below there lies the 36.72 support (September 29, 2014 low) near the 76.4% retracement of the 32.58/52.85 rise. 41.55 should cap near-term bounces.
Outlook:
Short term: bearish
Long term: bearish

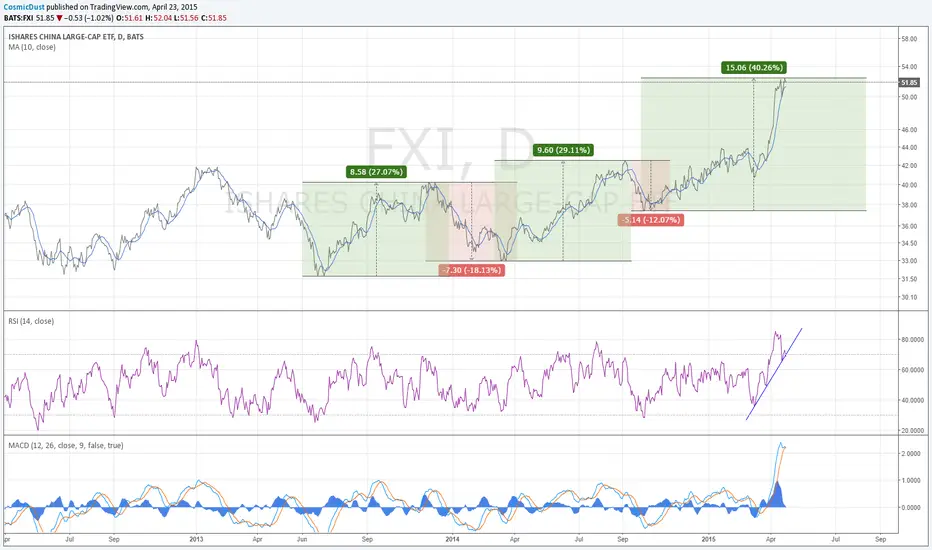
China - FXI - Bull & Bear Markets Since 2011The red lines are losses from trades if you had SOLD SHORT when a bear market had started (-20% move off of a closing high) and reversed and GONE LONG when a bull market had started (+20% move off of a closing low).
The latest signal closed out of the only profitable trade in 5 years.
This is just an educational piece and shows how choppy the Chinese market has been in the past 5 years.
Tim 12:08PM July 8, 2015

CHINA ETF - FXI - 2009 to present = sidewaysLook at all of the large drawdowns across the same price range.
2009 = 20% drop
2010 = 18% drop
2010 = 14% drop
2011 = 38% drop
2012 = 20% drop
2013 = 25% drop
2014 = 18% drop
2014 = 13% drop
2015 = 11% drop (so far)
From 2009's top until present - China is flat (measured by FXI), yet it has had MASSIVE VOLATILITY in price across a large price range. All of that "indigestion" (nearly 6 BEAR MARKET MOVES IN 5 YEARS!!!!) has led to a nice rally here at the end that has captured the world's attention. Their IPO market has stocks triple, rise 300%, on opening day. This action is what bubbles are made of.
What does the next 5 years hold?
Would you buy and hold from right here for 5 years?
Tim June 18, 2015

FXI update - short term bearish - 4/30/2015DO NOT LIKE what I saw. I believe it is heading towards 0.618 Fib ($45 level). Maybe wrong though.

FXI update - caution - 4/23/2015As of today's close, MACD turned negative, RSI trend line appears to be broken. Might be a good idea to take some profit off the table if they are not getting better in coming days (need be confirmed by short term price trend change).
FXI $50.25: Posted a new 7-year high at 52.56 near key retracemeFXI rallied strongly to post a 7-year high at 52.56 (April 16, 2015) near the 61.8% retracement of the 73.11/19.35 fall, before consolidating. The Technical indicators remains positive (on all time frames), reinforcing the bullish price action. Immediate support lies at 47.88 (21 day moving average, not shown on chart). Below rests 44.96 (April 1, 2015 low, near 55 day moving average) which should hold dips. If bulls manage to reclaim 52.56, that would accelerate the year-long uptrend towards 54.94 (May 1, 2008 lower high, near 76.4% of the 73.11/19.35 fall) next.
Outlook:
Short term: buy on pullbacks
Long term: bullish

FXI update - on 10 day MA support - 4/17/2015Held up pretty well today. However I will not be surprised if it retraces to 0.618 fib level. But it will be very impressive if it goes higher from there.

China Bubble with Symmetrical Trending Moves China Bubble with Symmetrical Trending Moves
It's obvious we are looking at a equity bubble in China. I'm not worried where this goes, I'm more interested in where this ends. I want to be on the put side of this ETF. I have most likely missed 2/3 of this price move. Volatility and price velocity will be much greater on the downside, and more money can be made when the bubble burst.
Symmetrical Lines
In this chart example I'm focused on large impulsive symmetrical moves on the downside. Both moves on the downside had similar angles. I marked these previous downward moves and added them to where Chinese ETF FXI brokeout.
Timing the Bust
I'm expecting the bubble to top somewhere between July 13 and August 28 (noted vertical line alarms on chart).
Pattern: Bump and Run
Price Trends
China Bubble Burst is Collateral Damage Around the World
US Bond Market with positive drift
US Stocks with positive drift

FXI update - neutral - 3/22/2015Still living in the rising wedge, with diverged RSI and MACD. Unless a break out, any gain will be limited, plus increased downturn risk.

FXI update - still some room to the downside - 2/1/2015FXI pulled back logically last week and should hit pink support and rebound. If pink support breaks, door is open to $36 level around the red support line. Note trend is still up but we need the pink support to hold.

$FXI moving higher but small correction possible 08-15-2014Price is still moving higher but momentum is waning. In the short term price may correct but no structural risk exists at this time


Is China going to lead emerging market?FXI/EEM ration still stuck in a range. But there is a bullish 3MA and 5 MA cross over, ratio is above 10 month MA, RSI appears to have formed an up channel. We will see if it can break the upper range in the coming months.

FXI China ETF (2)China FXI
Support :
Uptrend_line, 50 sma ( retest possible )
Targets :
40.33 ( rectangle top range )
41.60 ( 2013 high, 100% extension ) (brake_out condition)
Comments ( link )

FXI (China Large-Cap)China FXI
In a rectangular range between ~30-40 since end of 2011.
Versus Global Index, its basing.
Cyclically it looks like it is hitting some turning points,
needs price confirmation.
First Chart, long term view since 2007, crash and
long consolidation, within a closing triangle like formation. 200 sma.
Second chart, In an uptrend since 19/3, trying to brakeout,
on strong impulse. Indicators may have some room left.
Diagonal Channel. Rounding bottom formation. potential IHS.
Support :
Uptrend_line, 50 sma ( retest possible )
Targets :
40.33 ( rectangle top range )
41.60 ( 2013 high, 100% extension ) (brake_out condition)

FXI:China builds possible IH&SConsolidating the last three years inside this massive triangle, now building possible IH&S.
This demand zone supported very well through good volume, every time price reached the area.
Cheers
Panos

China is making a come backChina has been relatively flat on the weekly chart for the past 2-3 years after its initial pullback from its push out of the 2009 recession. It is my belief that China is back. Long term price consolidation in this relatively tight narrow band and the recent sell-off all point to low risk entry. Fears of recession or crisis in China are all fluff: China's government allows for swift top-down approach and also has a lot to learn from crisis in the west. most importantly, China is not overvalued, or , in my opinion even fairly valued by any traditional measure, so even if a crisis comes to china, downside would probably not be as crazy as it was in the west when markets were near all time highs.
Conclusion: China is offering a long term low risk entry point for years to come. I don't think this is a short term trade by any means, although one could use this information to prsumambly find stocks to take advantage

China 25 | "local good value" + divergencesOverextended %B (sub 2 std dev) indicates local "value".
Divergences on all three of FT, Mom and MACD.
Doji on high volume.
Combine to point to a reversal.
TP First target @ fractal cluster and previous congestion around 36 (greeen line). Or if %B hits upper green band. Stretch target of Fib at c.37
SL: maintain 1:1 risk reward?
Exit if not moving into profit with 3/4 bars.
