$FXI - China Large Cap ETF Monthly ChartFXI is China's large cap ETF. While I do not think this actually is a massive bear flag, it will be interesting to see how this plays out. Worst case you can play the trend. Good luck!
This is not a recommendation to buy or sell. It is for informational purposes only.
FXI trade ideas

Time to buy China?The price is sitting on a beautiful long term trend line ! Should we clearly break the down trend line to the upside, it is my opinion that prices should move much higher over the next 6-12 months ! Just my opinion :)

$FXI — SHORTDrop in vlume on the way up, doji forming, gaps open below the market, oscillators wayyy overbought — this is ripe for puts and I bought puts on BABA.

$FXI For 2022$FXI (iShares China Large-Cap ETF) looking like a good trade for 2022. I usually stay away from Chinese equities but with Alibaba down ~60% (almost 10% of the ETF) in the past year and their Fed indicating a looser monetary policy, it looks like a great value play to combat the recent US Fed rate hike.
$16M Darkpool print on Friday + Unusual OI for the 5/20 $40 Call. Looking for MACD to officially cross over...

I.T. cycle low do NOT be Short in anything in chinaIt seems that another cycle low is coming in look for a rather sharp bear market rally in baba and fxi for a week

A Spectacular Dip Buy Chinese Stock Exchange Chinese #FXI Large Cap ETF ready for a dip buy around here and I will be watching for the triangle to breakout above the red line.
Here are the top 15 holding of the ETF:
Symbol Holding % Assets
3690 Meituan Class B 9.51%
700 Tencent Holdings Ltd. 9.08%
9988 Alibaba Group Holding Ltd. 7.49%
939 China Construction Bank Corporation Class H 5.92%
9618 JD.com, Inc. Class A 5.39%
2318 Ping An Insurance (Group) Company of China, Ltd. Class H 4.21%
1398 Industrial and Commercial Bank of China Limited Class H 4.11%
9888 Baidu, Inc. Class A 4.06%
2269 Wuxi Biologics (Cayman) Inc. 4.02%
1810 Xiaomi Corp. Class B 3.39%
1211 BYD Company Limited Class H 3.31%
9999 NetEase, Inc 3.29%
3968 China Merchants Bank Co., Ltd. Class H 3.05%
3988 Bank of China Limited Class H 2.69%
2382 Sunny Optical Technology (Group) Co., Ltd. 1.92%

FXI - US Dollars Accumulate China ETFThe cyclical boogeyman of Chinese stocks have come down a lot with huge gaps down on the US exchanges. But in RTH, FXI has been accumulated strongly since April 2021 (meaning Asians are selling to Americans, these ETFs more and more held in dollars instead of CNY/HKD). Buy, testing the all time highs within a few years.
Call LEAPS.
Aggregate Volume Drift using mostly 10 minute accumulation/distribution data.

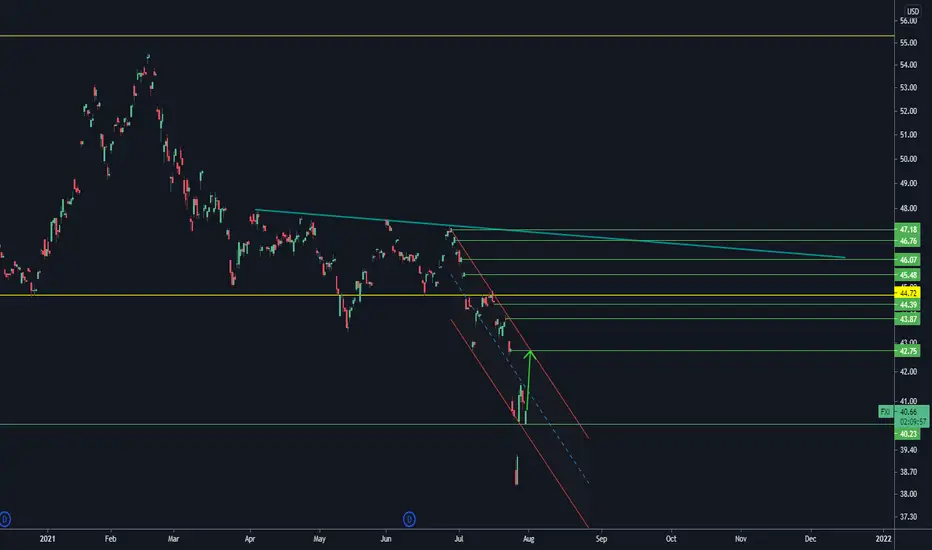
China LArge Cap ETF short term boost to higher highs. FXIAppearing to be a beginning of the Y in WXY in an otherwise complex correction. This is just a result of just the same as nothing can grow exponentially, nothing will fall unstoppably without seeing some respite from time to time.
We are not in the business of getting every prediction right, no one ever does and that is not the aim of the game. The Fibonacci targets are highlighted in green with invalidation in red. Fibonacci goals, it is prudent to suggest, are nothing more than mere fractally evident and therefore statistically likely levels that the market will go to. Having said that, the market will always do what it wants and always has a mind of its own. Therefore, none of this is financial advice, so do your own research and rely only on your own analysis. Trading is a true one man sport. Good luck out there and stay safe!

FXI, Immediate term trade and trendSignal didn't like FXI for a long time now. I have been short. And now it seems like there will be another short opportunity??
I will be keeping an eye on this
PS. Each box span a day, and the code gives short term and long term trends as shown. the trend is shown with the color of the box. The range is calculated on a daily basis.
If you want similar ranges and trends on your ticker, feel free to contact me, I will add them to my list and provide them when the signal is interesting (for free of course)
Redd

FXI LongWeekly Support Line
Entry 39.5
Stop 37.5
Target 45
Risk management is much more important than a good entry point.
The max Risk of each plan should be less than 1% of an account.
I am not a PRO trader. I trade option to test my trading plan with small cost.

Watching Chinese Names and ETFs - FXI $42 Early Next Week?BABA reports next week 8/3;
likely gives a catalyst for a move up to $210-220 for BABA and then a move for FXI to $42ish
(Opinion only)
FXI: Nice (potential) long tail doji!If the week does end up as a nice long tail doji, then now will be a good time to start accumulating some large cap China stocks!

FXI looking bullish long termA clear long-term ascending triangle pattern.
Breakout of the neckline would send us all the way up to $82
###NOT FINANCIAL ADVICE###


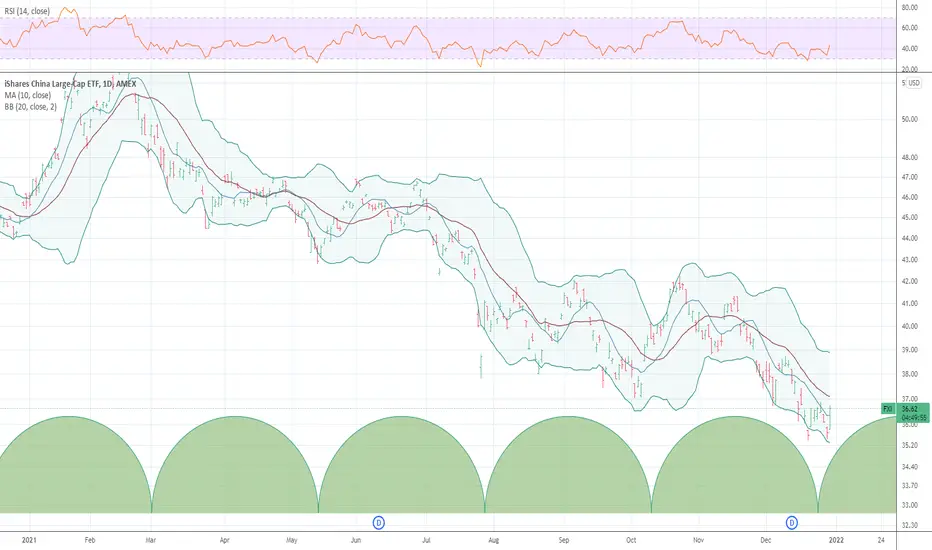
Chinese Stocks May Be TurningThe iShares China Large-Cap ETF had a big run last year, then pulled back and consolidated for 3-4 months. Now it’s showing signs of coming back to life.
Notice how FXI held roughly $45 after forming a kicker candlestick on June 16-17. Looking back to the other lows of May 13 and March 25, we discover an inverted head and shoulders pattern.
Next, FXI squeezed along its 50-day simple moving average (SMA) for the last month. Price action the last two sessions suggests that resistance has finally been broken.
MACD has also been steadily rising since late March. Combined with the mid-May low, this has resulted in bullish divergence.
Finally, the 8-day exponential moving average (EMA) has crossed above the 21-day EMA. The 21-day EMA is also trying to get above the 50-day SMA for the first time since the crash in February. That could signal a more significant change of direction in favor of the bulls.
TradeStation is a pioneer in the trading industry, providing access to stocks, options, futures and cryptocurrencies. See our Overview for more.


Asian Bear Markets Signals Corrections in US StocksChinese stocks are entering a bear market. China's holdings are very tech-heavy and mostly internet-based. ex. Alibaba, Tencent, JD, Baidu, Weibo, IQIYI. The Chinese government has concerns over the power these large corporations can wield on their citizens leading to increased regulation. Likewise, the US Government has been closely watching their own tech giants in an effort to reduce their influence. Inflation fears have also affected Tech valuations with these being seen in both Asia and US markets. As inflation rises, nominal rates also rise increasing the discount rate for discounted cash flow valuations. Furthermore, many funds and retail traders are leveraged (margin) in the Asia markets, and once things start to unravel it usually leads to faster declines.
Tech stocks are a leading indicator of the broader market. Semi and Tech dictate the path of the economy. There is a strong positive correlation between semiconductor growth and economic expansion. The semiconductor manufacturing process is expensive and involves large amounts of capital making it more sensitive to changes in interest rates. If China's economy is headed for a downturn then, the world economies will eventually join them. China is a good leading indicator because, the issues that affect China's manufacturing will be felt by the United States, Europe. The past bear markets in China have served as a leading indicator of the direction US Tech Markets will take.
Taiwan is more heavily invested in industrials and manufacturing ex. TSM.

Short FXIFinancials in general are down. With the QQQ crunch, markets correcting, this guy has some room to correct down.


FXI chinese shares under threat of delisting in headlines, bad bad bad sign for investors if shares keep being threatened for delisting. confidence will be shooketh.

#FXI $FXI China Large Cap #ETF . 100 EMA strong support #FXI $FXI China Large Cap #ETFs . 50 EMA strong support Watching.
