Go Long on Video Games!Sorry for the lack of ideas yesterday; there were some issues with my OmniBands indicator. But everything has been resolved, so it's time to get back to work! Here's a great index fund that you should definitely consider adding to your portfolio:
GAMR® provides pure-play and diversified exposure to
Key stats
About Amplify Video Game Leaders ETF
Home page
Inception date
Mar 8, 2016
Structure
Open-Ended Fund
Replication method
Physical
Dividend treatment
Distributes
Distribution tax treatment
Qualified dividends
Income tax type
Capital Gains
Max ST capital gains rate
39.60%
Max LT capital gains rate
20.00%
Primary advisor
Amplify Investments LLC
Distributor
Foreside Fund Services LLC
GAMR provides exposure to the global video gaming industry by investing in companies comprising the video game value chain. The initial universe is identified based on listing, liquidity, size, and revenue requirements. Eligible securities are then ranked according to market-cap with the top 20 companies included in the index. The index imposes a banded market-cap ranking to weight the constituents wherein securities are divided into three bands based on size. The first band consists of the top five companies, each receiving a 10% weighting. The second band comprises the 6th10th ranked companies, each given a 5% weighting. The last band covers the bottom 10 companies, each allocated a 2.5% weighting. On January 29, 2024, the fund acquired all assets and liabilities of the Wedbush ETFMG Video Game Tech ETF, morphing into a new ETF that employs the same strategy. Prior to January 28, 2025, the fund was named Amplify Video Game Tech ETF, tracking the EEFund Video Game Tech Index.
Related funds
Classification
What's in the fund
Exposure type
Technology Services
Electronic Technology
Stock breakdown by region
Top 10 holdings

Ooops! Drat! GAMR whips NASDAQ!While many were obsessed with Bitcoin and Gold, they missed GAMR! This was certainly a smoother ride to the top, if you caught it in time.
Okayyyyy.. I missed it too! LOL.
Anyways, I'm sharing. We need more people sharing stuff like this when they spot it early on.
Now may not be a good time t

GAMR - VIDEO GAME ETF / GREAT LONG TERM PLAY 0. TOP HOLDING FOR THIS ETF
Video Games, From All Over the Globe. Great "Stay at Home" basket of Gaming Stocks;
DouYu International Holdings Ltd. Sponsored ADR 2.97%
IGG, Inc. 2.84%
Webzen Inc. 2.68%
Bilibili, Inc. Sponsored ADR Class Z 2.62%
Netmarble Corp. 2.58%
NetDragon Websoft Holdings L
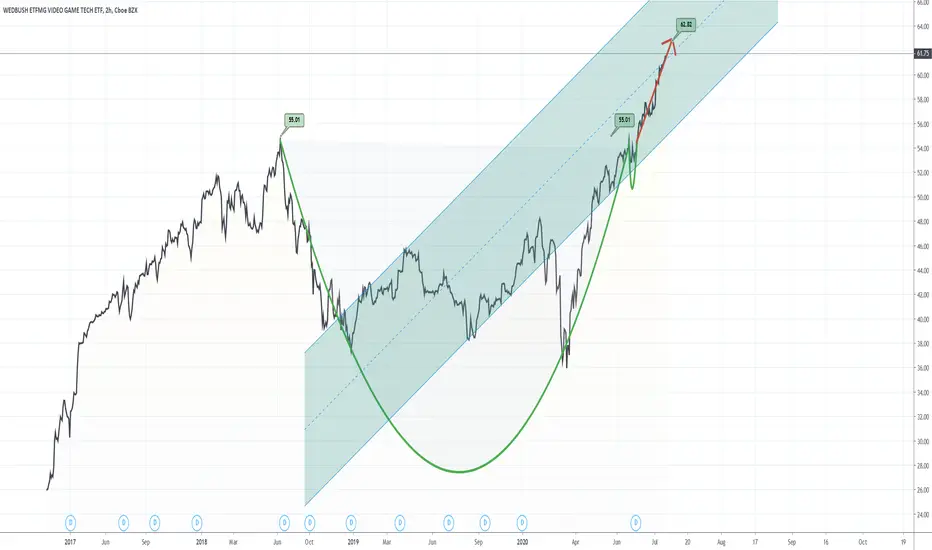
Long on the video game industryVideo games are a safe asset, everyone likes to play games from 7 to 77.
This ETF has a nice and diversified basket of the whole video industry, from hardware maker to software companies.
I believe this ETF is a buy and hold.
etfdb.com

See all ideas
Summarizing what the indicators are suggesting.
Oscillators
Neutral
SellBuy
Strong sellStrong buy
Strong sellSellNeutralBuyStrong buy
Oscillators
Neutral
SellBuy
Strong sellStrong buy
Strong sellSellNeutralBuyStrong buy
Summary
Neutral
SellBuy
Strong sellStrong buy
Strong sellSellNeutralBuyStrong buy
Summary
Neutral
SellBuy
Strong sellStrong buy
Strong sellSellNeutralBuyStrong buy
Summary
Neutral
SellBuy
Strong sellStrong buy
Strong sellSellNeutralBuyStrong buy
Moving Averages
Neutral
SellBuy
Strong sellStrong buy
Strong sellSellNeutralBuyStrong buy
Moving Averages
Neutral
SellBuy
Strong sellStrong buy
Strong sellSellNeutralBuyStrong buy
Displays a symbol's price movements over previous years to identify recurring trends.
Frequently Asked Questions
An exchange-traded fund (ETF) is a collection of assets (stocks, bonds, commodities, etc.) that track an underlying index and can be bought on an exchange like individual stocks.
GAMR trades at 88.19 USD today, its price has fallen −1.52% in the past 24 hours. Track more dynamics on GAMR price chart.
GAMR net asset value is 88.10 today — it's risen 5.93% over the past month. NAV represents the total value of the fund's assets less liabilities and serves as a gauge of the fund's performance.
GAMR assets under management is 44.17 M USD. AUM is an important metric as it reflects the fund's size and can serve as a gauge of how successful the fund is in attracting investors, which, in its turn, can influence decision-making.
GAMR price has risen by 7.76% over the last month, and its yearly performance shows a 41.68% increase. See more dynamics on GAMR price chart.
NAV returns, another gauge of an ETF dynamics, have risen by 5.93% over the last month, showed a 22.80% increase in three-month performance and has increased by 41.76% in a year.
NAV returns, another gauge of an ETF dynamics, have risen by 5.93% over the last month, showed a 22.80% increase in three-month performance and has increased by 41.76% in a year.
GAMR fund flows account for −9.49 M USD (1 year). Many traders use this metric to get insight into investors' sentiment and evaluate whether it's time to buy or sell the fund.
Since ETFs work like an individual stock, they can be bought and sold on exchanges (e.g. NASDAQ, NYSE, EURONEXT). As it happens with stocks, you need to select a brokerage to access trading. Explore our list of available brokers to find the one to help execute your strategies. Don't forget to do your research before getting to trading. Explore ETFs metrics in our ETF screener to find a reliable opportunity.
GAMR invests in stocks. See more details in our Analysis section.
GAMR expense ratio is 0.59%. It's an important metric for helping traders understand the fund's operating costs relative to assets and how expensive it would be to hold the fund.
No, GAMR isn't leveraged, meaning it doesn't use borrowings or financial derivatives to magnify the performance of the underlying assets or index it follows.
In some ways, ETFs are safe investments, but in a broader sense, they're not safer than any other asset, so it's crucial to analyze a fund before investing. But if your research gives a vague answer, you can always refer to technical analysis.
Today, GAMR technical analysis shows the buy rating and its 1-week rating is buy. Since market conditions are prone to changes, it's worth looking a bit further into the future — according to the 1-month rating GAMR shows the buy signal. See more of GAMR technicals for a more comprehensive analysis.
Today, GAMR technical analysis shows the buy rating and its 1-week rating is buy. Since market conditions are prone to changes, it's worth looking a bit further into the future — according to the 1-month rating GAMR shows the buy signal. See more of GAMR technicals for a more comprehensive analysis.
Yes, GAMR pays dividends to its holders with the dividend yield of 0.03%.
GAMR trades at a premium (0.11%).
Premium/discount to NAV expresses the difference between the ETF’s price and its NAV value. A positive percentage indicates a premium, meaning the ETF trades at a higher price than the calculated NAV. Conversely, a negative percentage indicates a discount, suggesting the ETF trades at a lower price than NAV.
Premium/discount to NAV expresses the difference between the ETF’s price and its NAV value. A positive percentage indicates a premium, meaning the ETF trades at a higher price than the calculated NAV. Conversely, a negative percentage indicates a discount, suggesting the ETF trades at a lower price than NAV.
GAMR shares are issued by Amplify Holding Co. LLC
GAMR follows the VettaFi Video Game Leaders Index - Benchmark TR Net. ETFs usually track some benchmark seeking to replicate its performance and guide asset selection and objectives.
The fund started trading on Mar 8, 2016.
The fund's management style is passive, meaning it's aiming to replicate the performance of the underlying index by holding assets in the same proportions as the index. The goal is to match the index's returns.