GDX Beautiful on all time framesIn GDX 40c .98 avg for 6/18
Monthly C&H, Metals are hot, inflation concerns = metals bullish
Flagging on Hourly and Daily is hot
GDX trade ideas

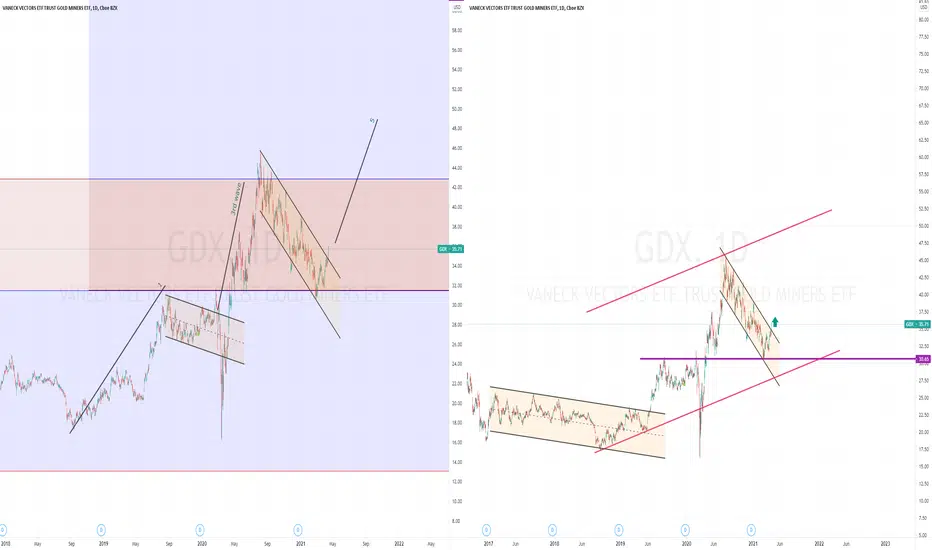
GDX - Senior gold miners, golden crossGDX is an etf of senior gold miners. The golden cross (50 ma crossing above 200 ma) has occurred and has formed a flag on daily. The next fomc is not until june 15th, so we may chop here or pull back, depending on economic data.


GDX higher into June regulatory shake up for LBMAJune 2021: May see the beginning of the end of the London Bullion Market Association
The London Bullion Market Association (now known simply as LBMA), established in 1987, is the international trade association representing the global Over The Counter (OTC) bullion market, and defines itself as "the global authority on precious metals".
There will be a requirement for banks holdings to meet a ratio limit between tangible assets and unallocated assets. The ratio is named Required Stable Funding and the crux of the matter is that if the bullion banks can no longer trade their paper and unallocated gold without holding physical allocated assets, the derivatives market could collapse. The 3 parts of the Basel 111 regulations that affect the paper gold markets are:
• The Available Stable Funding factor (ASF) is applied to the sources of a bank’s funding on the liability side of its balance sheet. Depending on the liability (shareholders’ equity, customer deposits, interbank loans etc.) they are multiplied by a factor, from 100% for the most stable forms of funding, such as Tier 1 bank equity, to 0% for the least stable. Being on their balance sheets, unallocated gold owed to a bank’s deposit customers is to be given a Basel III ASF of 0%, which means it will not be permitted to be a source of funding for any balance sheet assets, which must therefore be funded from other liabilities.
• The Required stable funding (RSF) is to be applied to a bank’s assets. Unallocated gold positions are to be valued at 85% of their market value. Note that allocated gold, being held in custody, is not on bank balance sheets (except where the bank actually owns physical gold in its own right) and is therefore not involved in the calculation.
• The Net stable funding requirement (NSFR) is the ASF divided by the RSF and must be at least 100% at all times.

GDX resistance areaBig gap down resistance area from early november and getting overbought, some flagging here or a pullback maybe.

GDX - Resistance and Support zonesThis is a follow up of previous post.
GDX has moved up as expected.
I am trimming my position here. Sharing a couple of parameters I am looking at.


GDXBreakout above 200DMA. Ichimoku cloud on Daily is looking great. I think it is ready for farther advance

GDX is bullish in the long runGDX has broken its counter trendline on the weekly, clearly showing where we can expect the precious metals in the near future. New highs are on the spot in this commodity supercycle.

GDX support zoneRisk vs Reward alert is good here as long as the support zone holds.
GDX broke out of the down trend line / resistance zone, and pulling back to test the zone again.
In EW cycles, GDX looks to be forming micro 3 - 4.

Chart of the Week: GDXGDX is showing both bullish and bearish price action.
GDX reversed off of the 0.5 retracement level from the impulse move up from March 20 to August 20. A reversal at the 0.5 is considered bullish and a buying opportunity. However, I believe there is clearer evidence of a bearish move. A head and shoulders pattern formed in white. GDX looks to of formed a topping pattern. We can forecast targets by taking the height of the head to neckline under the neckline as shown in white. GDX also may of just finished leg B of the ABC move down. The 1 to 1 retracement of leg A and B puts the end of the C wave at around $21-22 the same expected target for the head and shoulders. Starting of with a small short position.
GDX moves in turn with EEM and TIPS ( Treasury Inflation Protected), I am expecting eventual downward moves in these also.

US10Y yields and Gold Miners (GDX)Gold is an inflation hedge, so expect to see XAUUSD rising as the CPI and PCE data prints show consistent prints above 2% on average for the year.
US10 year yields steepen against the 2-year yield as short-term inflation expectations are crushed by QE and low-interest rates but medium-term inflation risks are starting to show their presence in the cost of commodities, materials, and rising wages. The Fed is adamant that the current signs of inflation will be transitory and as the base effects from last year fall out of the year-on-year data readings the inflationary pressures will ease.
Gold producers on the COT report had trimmed their short positions from the beginning of 2021 until April but have started selling more again as the price of Gold bounced off $1700, which make me feel that the range between $1700 to $1900 is here to stay for a while longer.
One way to try and capitalise on the price of Gold without the need for it to break $2k necessarily is to invest in a Royalty or Streaming company. With prices for mining output already set, the Royalty companies can still make money even when the gold price is falling. They don't operate mines themselves, and so the huge infrastructure and operating costs do not fall to them.

GDX - Gold Stocks picking up steamGDX is attempting to break north of the channel/flag today. We need to see if it holds in the next couple of days - if it does will likely add to existing precious metals/pm stocks/long positions. Large caps will lead small caps so GDXJ will be the place to be.. This has the potential to be the beginning of a large move higher..


GDX need to break 36.50 would be bullishGDX shows signs of completion of downtrend has crossed 50 dma and 20 EMA this week. This makes GDX bullish for next week for a target 35...Above 36.5 closure will lead to wave 3 rally ...to reach a target of 60.
Elliot wave correct of 1.764% have been completed for GDX.. but i will turn bullish longer term above 36.5...

Buy at the checkmark tomorrowLooks like a solid back-test of some heavy resistance. Buy 4/20/21 in the AM if there is any more pullback - 35.25-35.45 entry.


GDX breaking out from a multimonth down-trendAMEX:GDX is looking promising with today's breakout from a downward channel that started in August 2020, with OANDA:XAUUSD closing above resistance of USD 1760.


GDX: In the Arc We TrustAMEX:GDX has formed long-term support that has been built upon the arc shown in the chart. Should this arc prove to be true and continue to hold, it will lead us to our SCOTCHstocks initial target range of $52-$60.
Everything shared here is my own opinion and no results are guaranteed. Good luck!
