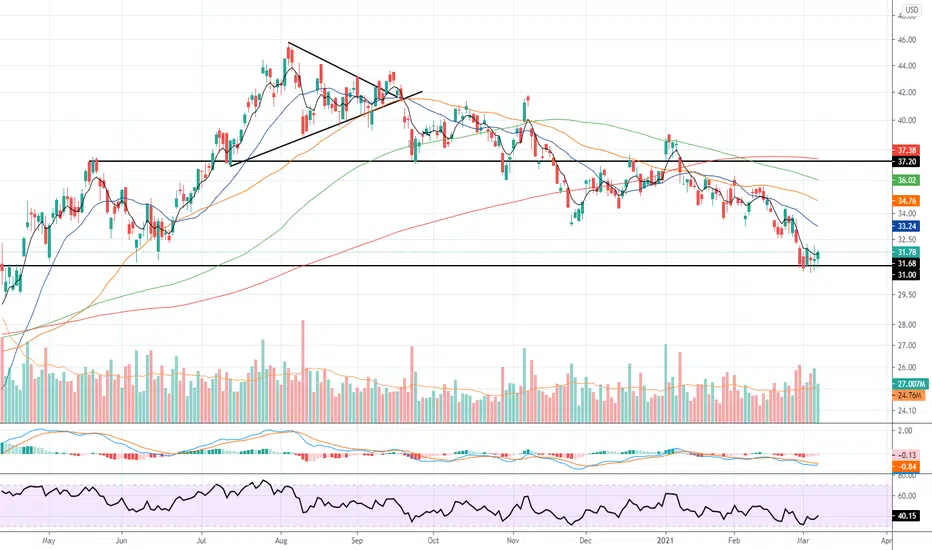
Big level, I still like this above 31I added this just above 31. Huge level, if break under significantly I will be out. Touched bottom of channel as well, we are chillin currently, watching FOMC closely.
GDX trade ideas

GDX Bearish pennant A bearish pennant or half way pattern (down) is building up for GDX. A break of the pennant will bring GDX down to region $27.5 smack on the 0.38 Fib retracement of the entire move from March 2020 to August 2020. Gold miners are looking great value but Silver miners may still have more downside.


GDX, is this a forgotten treasure?Hello everyone,
So Gold is finally back in a buy/accumulation zone, even though DXY may have more room to run I doubt this will translate in to heavy downside for gold. 1650 maybe? However, the stars look alligned once again to buy gold, or in this case GDX (Gold miners ETF). You can see the trade parameters in the chart. But this is definetely an opportunity like no other, whilst everyone is still lookin at Bitcoin, or Stocks, nobody is expecting a resurgence from gold at this point. However as we see volatility is not dead and gold does like volatile times. Even though this trade will take patience, and most likely won't payoff like crypto. The optimal upside is around a 150%, and in a mania case 400-600%. And the risk is -25%, I mean, it's a casual day in crypto or even stocks these days... Buying now is like buying BTC at 10k. Which BTW i've also advised in doing heavily. It's the same mantra as always - Buy low, sell high. However, most will do it the other way around.
Also check out my other ideas, even though I don't post often. When I do it's usually when things are CHEAP or EXPENSIVE.
As always, stay safe and stay liquid.

GDX @ supportexpect gold miners to make a bounce
GDX @ sopport level + fibonacci level combined.
expect US10 yeild to move lower inverse to gold


GDX false breakdownLike this negating a bearish pattern. Will add in the next few days, if the market give me the chances. Otherwise wait until channel breakout.

Senior Gold Miner's Daily Renko Log ChartMeasured moves with 2 different techniques yields a 73.50$ target.
Let's see how confluence or support helps the turn around upwards.

GDX... still in bear modeGDX... no change in trajectory - bearish.
Previously, called and exited near the top in August 2020 and expected this bearish tones.
Noted BRB Buy Signal triggered as well as the RPM attemping to turn bullish.
Otherwise, MACD is clearly heading down and GDX gapped down to break two support levels in one candle.
More downside seen, at least to 30. possible maximum stretch to 26.

Add some Gold Mining stocks to your listA powerful upside move is just moments away. Easy to spot this as we could see higher lows and price staying above the 200-day moving average over long period of time (don't actually need any other indicators. $130 (3x) upside is just conservative if you plan to hold this for 6-12 months. I am adding this ETF to my portfolio.

Set your buys lowerI think in order to refuel a market wide correction will occur bringing all assets lower and cash higher.
This is a perfect time to load up on gold miners and gold for a q2-q3 rally to ATH.

OPENING (IRA): GDX FEBRUARY 19TH 33 SHORT PUT... for a .42/contract credit.
Notes: I have a smidge of SLV and GLD on, but didn't want to add to my GLD due to its crappy 30-day, and SLV drives me nuts somewhat with its lack of strike to strike granularity, so hitting the miners with a small position with a 30-day at 43.9% and its expiry-specific at 42.7%. 1.29% ROC at max; 10.5% annualized.


Gold Miners vs Gold Ratio on monthly chartLooks like the miners weakness is weakening... wait.. does that makes sense?

GDX Next 37.58, 39.2GDX next potentail resistance 37.58 & 39.2. Its signal line is nearing to cross MACD line.

GDX - Miners are Ready to Rock and RollGDX - Miners are Ready to Rock and Roll
Keeping this short and simple
Daily/Weekly Set-up
Entry on Pre-market Gap-up or 32.25 double bottom if we drop (which i doubt)
1st Target = 38
2nd Target = 42
Hodl target = 45+
______________________________________________________________________________________________________________________
This content is for informational, educational and entertainment purposes only. This is not in any way, shape or form financial or trading advice.
Good luck, happy trading and stay chill,
2degreez

$GDX .. Bullflag hereJust like GLD .. GDX is in bullflag mode.. Holding this key level nicely .
GDX likes to start rolling before GLD usually .. keep some individual slow floaters in GDX etf on your radar !

GDX PLUMMETCall me crazy but, I don't give a <3.
The miners don't lie. Bearish Head and Shoulders formation. That is top if I ever seen one. 26 is the minimum lower target. 20 is the target I would like to see. At 12- 16 I will take out a loan to invest in GDX.
The economy is not in good shape as demonstrated by GDX acting weird and very bearish. It is well known GDX is a "proxy of liquidity". We see a very illiquid market upon us as, demonstrated by WSBets and GME. An illiquid market that starts to break down will summon another event like March. If we see the VIX get much higher there will be a crazy deleveraging and fleet to cash. Most Algos take in an input of the VIX. So as, the Vix reaches higher and higher price levels selling of risk assets occurs. The VIX looks like it is cooling off at a big move this week but, its just gaining more "power" or "potential energy". As, GDX moves down Gold and Silver will follow.
**I like to analysis the fundamentals, investing > trading ... look at the amount of wealthy investors vs. traders. excluding quant traders. My strategy is Buy Low Sell High. I think the market can bubble up for 1-3 months then have a blow off top with the amount of retail buying. As you can see, I am looking at a 10 year chart. I don't know the exact timing but, its coming that's for sure and all fundamental signs are pointing to it. I am not trying to instill fear just, acknowledging its existence.
Full Disclosure: I have been short GDX since October. Long Bonds, Long VIX, Still holding stocks waiting for a last leg up, I will exit stocks near end of February.


GDX- Miners Reaching Lower?A break of the inclining support originating from Jan 2016 may trigger some selling pressure as it would complete a Head and Shoulders pattern. This may be an inverse expression to the IHS forming on the DXY. I'm about 70/30 convinced of this right now. The attached link makes a strong dollar case.
The average distance from head to neck results in a projected 24$ target, with the very base support above 22. If this played out similar to other sell-offs, we could expect the downward pressure to reach 24+ and ease before turning between Feb 1st and Apr 19th. This could be an algo/leverage driven flash sale so we might expect equal violence to the upside later in the summer/fall. (15% chance?)
What is more probably more likely is that the chart will bounce in the 28 range before deciding to follow-through to 24 or, consolidate and ultimately resume an up-trend. (85% chance)
Whether this coincides with a broader market decline remains to be seen, though my suspicions tell me that this week (Jan 25th-30th) will be very telling.
