$GDX Bull Flag Daily Chart AMEX:GDX Bull Flag Daily Chart
📊 AMEX:GDX is showing a Bull Flag on the daily chart—a classic pattern that could signal continuation to the upside. Keep an eye on potential breakout levels! 🚀
#GDX #Gold #BullFlag #TechnicalAnalysis #Investing #Finance #MarketTrends
GDX trade ideas

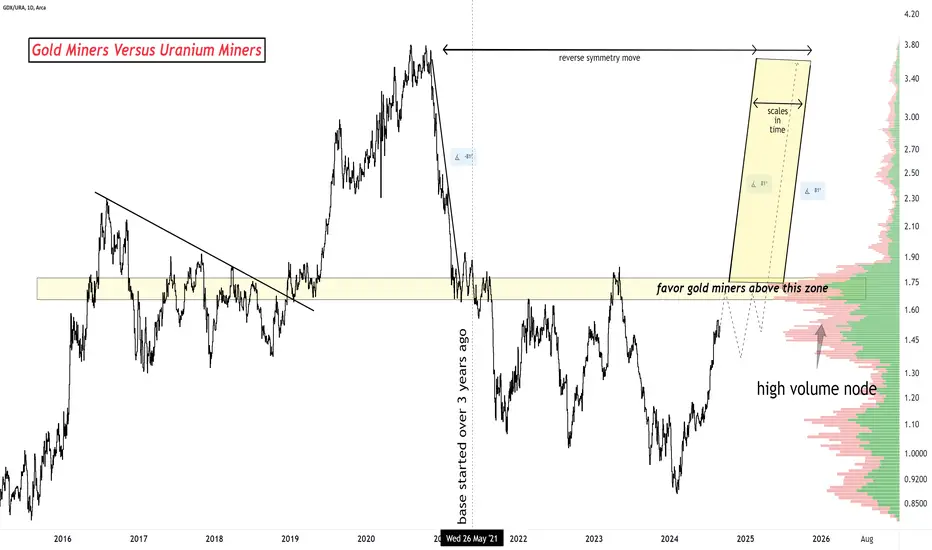
Gold Miners versus Uranium MinersYep, #gold #miners are setting up for a very impressive move to outperform #uranium #miners.
But don't trust me, just look at the chart below!
Elliott Wave Intraday Analysis Looking for GDX to Extend HigherRally from 9.26.2022 low in AMEX:GDX is currently in progress as a 5 waves diagonal. Up from 9.26.2022 low, wave (1) ended at 36.26 and pullback in wave (2) ended at 25.62. The ETF then extended higher in wave (3) towards 39.4 and pullback in wave (4) ended at 33.85 as the 1 hour chart below shows. Internal subdivision of wave (4) unfolded as a double three Elliott Wave structure. Down from wave (3), wave W ended at 35.9 and wave X ended at 38.22. Wave Y lower ended at 33.85 which completed wave (4) in higher degree.
The ETF then turns higher again in wave (5). Up from wave (4), wave ((i)) ended at 36.25 and wave ((ii)) pullback ended at 34.54. Wave ((iii)) higher ended at 38.08 and pullback in wave ((iv)) ended at 36.56. Expect wave ((v)) to complete soon which should also end wave 1 in higher degree. Afterwards, it should pullback in wave 2 to correct cycle from 8.5.2024 low in 3, 7, or 11 swing before the ETF resumes higher again. Near term, expect pullback to find support in 3, 7, 11 swing against 33.85 for further upside.

GDX, Gold Miners upmoveAs mentioned in my other post, Gold Miners are going to outperform Gold Spot prices as we move ahead. Expect target range is between 60-65 by end of year.
This is not a financial advise, please follow proper risk management.
If you like the idea, kindly like and share. :)

Gold will underperform over the next 30+ daysDon't think there's good value in precious metals, right now. It'll likely under perform against oil and indices over the next 30 days. In all likelihood, investor are rotating out of the gold position and will continue to do so in the coming weeks. A better choice would be oil than precious metals.


Elliott Wave Expects Gold Miners ETF (GDX) to Continue RallyShort Term Elliott Wave View in Gold Miners Junior (GDX) shows that cycle from 10.4.2023 low is in progress as a 5 waves impulse Elliott Wave structure. Up from 10.4.2023 low, wave 1 ended at 32.35 and pullback in wave 2 ended at 25.67. Wave 3 higher ended at 37.47 and dips in wave 4 ended at 32.83 like the 1 hour chart below shows. The ETF has turned higher in wave 5 with internal subdivision as another impulse in lesser degree.
Up from wave 4, wave i ended at 33.35 and wave ii ended at 32.98. Wave iii higher ended at 34.79 and pullback in wave iv ended at 34.35. Final wave v higher ended at 34.83 which completed wave (i) in higher degree. Wave (ii) dips unfolded as a zigzag Elliott Wave structure. Down from wave (ii), wave a ended at 33.8 and wave b ended at 34.58. Wave c lower ended at 33.28 which completed wave (ii). The ETF has rallied higher again. Up from wave (ii), wave i ended at 34.63 and wave ii ended at 33.65.
Wave iii higher ended at 36.53, and dips in wave iv ended at 35.51. Expect wave v to end soon which should complete wave (iii). Afterwards, it should pullback in wave (iv) to correct cycle from 6.26.2024 low before it resumes higher again. Near term, as far as pivot at 32.83 low stays intact, expect pullback to find support in 3, 7, 11 swing for more upside.

Miners need more consolidation before taking off from wedgeI don't think it's quite their time yet, I see a fall, a month of meandering, before launching and hitting my green target.

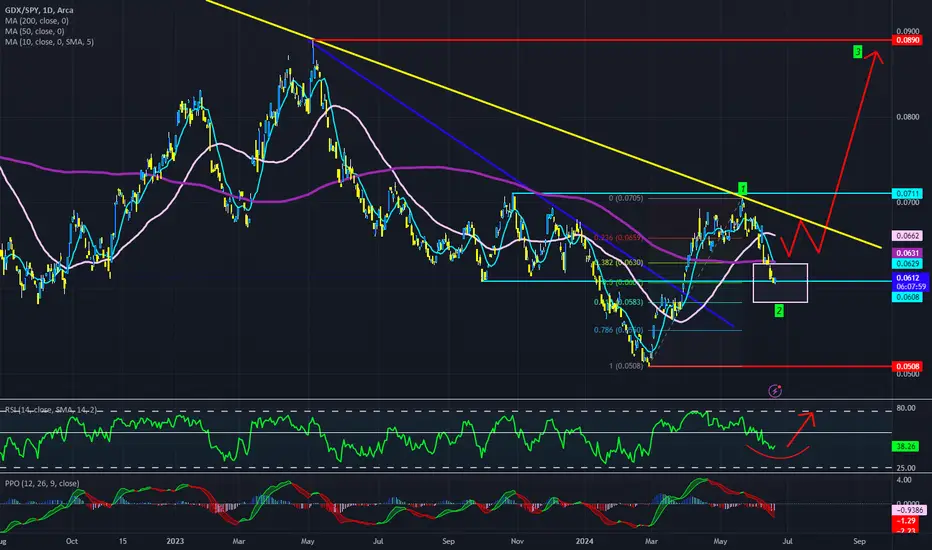
GDX (GoldMiners) vs SPX looks set to RIP higher in coming monthsChart of GDX (precious metals miners) vs SPY (SP500).
Looks to me like we are prepping to RIP higher in coming months.
Be ready.

Stay long GDX gold minersSimilar to the patterns playing out elsewhere, the "inflation trade" is still supportive of hard assets (and miners). GDX has had a nice pullback into 38% and move ave support. I've been long for quite a long time but those looking to get some exposure can use this as an opportunity.
Long 34, Stop 32, Trgt 40
Return/Risk = 3:1

GDX break out Have been tracking Gold and the Gold miners ETF GDX... It has been a while and it appears that Gold and GDX are at least in sync again.
GDX appears to have closed the week above the long term range and just broke out, if not about to...
MACD and VolDiv have not yet crossed over but indications show. The TD Setup is still showing primary bullish and a new Setup is forming, with a target to close above 36.26 within the next two months.

Where the market maybe going and my positions Looks to me the market is stalling up here. Vol not good and with high rates bad for tech
staying short TNA Long SQQQ Long GDX

GOLD MINERS GDX - 4 Years of pain?A inverse #HVF appears to be in progress on the #GDX
@TheCryptoSniper
Coincides with a probability that gold has put in a major secular top being pushed down by positive real rate environment.

Elliott Wave Intraday Analysis on GDX: Further Rally ExpectedShort Term Elliott Wave View on GDX suggests that rally to 35.74 ended wave 3 on April 12, 2024. From there, the ETF pullback as a double three Elliott Wave structure. Down from wave 3, wave (a) ended at 33.44 and wave (b) ended at 34.35. Wave (c) lower ended at 32.43 which completed wave ((w)). The ETF then rallied in wave ((x)) as as a double three structure in lesser degree. Up from wave ((w)), wave (w) ended at 33.95 and wave (x) ended at 33.11. Wave (y) higher ended at 34.31 which completed wave ((x)).
The ETF then extended lower in wave ((y)) as a zigzag Elliott Wave structure. Down from wave ((x)), wave (a) ended at 32.78 and wave (b) ended at 33.60. Wave (c) lower ended at 31.90 which completed wave ((y)) of 4. The ETF has turned higher in wave 5. Up from wave 4, wave i ended at 33.3 and wave ii ended at 32.79. Wave iii higher ended at 34.95 and pullback in wave iv ended at 34.07. Expect the ETF to extend higher in wave v to complete wave (i). Afterwards, it should pullback in wave (ii) to correct cycle from 4.23.2024 low before it resumes higher. Near term, as far as pivot at 31.9 low stays intact, expect pullback to find support in 3, 7, 11 swing for further upside.

GDX LONGWent long here on GDX at 27.40 on this wedge retest. If you look at the weekly chart it appears an inverted head & shoulders is forming. I like this long with a LIS at 26.59, as long as that holds I think we move back towards 30.16 and then 33.

Opening (IRA): GDX February 16th 29 Monied Covered Call... for a 28.24 debit.
Comments: GDX (IVR/IV 40.8/ 32.9) is at the top of my IV screener for ETF's (along with GDXJ, which has higher IV, but is less liquid).
Buying stock and selling the -71 delta call against, resulting in a max profit potential of .76 ($76)/contract; 2.69% ROC at max; 1.35% at 50% max. That .76 isn't massively compelling, but the ROC is "decent" for what I'm trying to do in the IRA on a month-month basis.

Opening (IRA): GDX August 16th 22 Monied Covered Call... for a 21.01 debit.
Comments: There isn't much that is weak in this market ... . Adding a rung to my GDX position out in August at a strike lower than what I currently have on. (See Posts Below).
.99 max on BPE of 21.01; 4.7% ROC at max; 2.4% at 50% max.

GDX Gold minersGDX Gold miners are finally showing some short term momentum, still range bound, looks promising for a long term if convincingly break the range

Gold Miners ETF (GDX) Extending Higher in Impulsive StructureShort Term Elliott Wave view in Gold Miners ETF (GDX) suggests rally from 2.29.2024 low is in progress as a 5 waves impulse structure. Up from 2.29.2024 low, wave ((i)) ended at 30.48 and pullback in wave ((ii)) ended at 28.91. Internal subdivision of wave ((ii)) unfolded as a zigzag structure. Down from wave ((i)), wave (a) ended at 29.71 and wave (b) ended at 30.08. Wave (c) lower ended at 28.91 which completed wave ((ii)). The ETF then resumed higher in wave ((iii)) with subdivision as an impulsive structure.
Up from wave ((ii)), wave (i) ended at 30.9 and dips in wave (ii) ended at 29.53. The Index extends higher in wave (iii). Up from wave (ii), wave i ended at 30.39 and pullback in wave ii ended at 29.79. Wave iii higher ended at 32.69 and wave iv pullback ended at 31.71. Expect wave v of (iii) to end soon, then it should pullback in wave (iv) before the ETF extends higher again in wave (v) to complete wave ((iii)). Near term, as far as pivot at 29.53 low stays intact, expect pullback to find support in 3, 7, or 11 swing for further upside.

Roadmap for GDXA quick update on my thoughts on GDX ...
A leading diagonal (1) followed by a flat (2), with wave (2) retracing 0.618 of wave (1)
We should see a wave (3) occurring .....

Opened (IRA): GDX March 15th 27 Monied Covered Call... for a 26.21 debit.
Comments: 42.2 IV/32.8% 30-day IV. Before I went to take a nap, added a "rung" on weakness here to my position, buying a one lot and selling a -75 call against. I already have a February monied on (See Post Below), so went out to March for this setup.
The call IV at the 27 strike: 37.32%. The put side at the same strike: 29.49% with their respective maxes being .79 for the 27 monied; .49 for the 27 short put.
As previously noted, this only makes sense in a cash secured environment where you don't get much BP relief by hanging out in the options. This cost 26.21 to put on in the IRA; the 27 short put would cost 26.51. Compare on margin: 26.21 buying power effect for this setup, 3.18 BPE for the 27 short put. Put another way: you generally don't do this setup on margin because it isn't BP efficient.
Metrics:
Buying Power Effect/Cost Basis/Break Even: 26.21
Max Profit (The Short Call Strike Price - Cost Basis): .79 ($79)
ROC %-age At Max: 3.01%/15.70% Annualized
ROC %-age at 50% Max: 1.51%/7.85% Annualized

Gold Miners versus Gold : the moment has come to buy.It is time to consider being LONG Gold Miners / SHORT Gold.
The chart speaks for itself. The ratio is not at absolute low however below the low of 2008 and within the low area
There is a 4 years cycle 2008-12-16-20-24 alternating low and high. Final low is expected this year.
After which the ratio will rise up until 2028.
Should 24 be challenged (supported by rising Gold prices), then P&F chart theory suggests that the bullish trend will target 48
It can be observed that EURUSD follows the same 4 year cycle. Therefore we are bullish on the European Currency.
