GDX trade ideas

Consolidation Continues for Precious Metal Mining StocksGold miners have shown relative weakness to the metals since topping in 2020, and that looks likely to continue in the near term. However, when this consolidation completes, the mining stocks should once again shine and starts catching up, potentially in the next couple of months.
For this reason, the time has come to keep this group on your watch list as a bottom below the October 2023 level of 25.65 on GDX could prove to be a durable bottom that will serve as a base to move GDX back over the ~ 36 high, and could even see prices breaking over the 45.76 high from 2020. These would likely represent ~ 46% and 86% upside moves respectively, so well worth a long trade.
A bit more patience is needed until this group will be ready, but could coincide with a pullback in the market in the coming months.
The downside levels of interest are ~ 24.1-24.6, and 22.8 to look for evidence of a bottom formation.

Gold continues sideways consolidationGold will make new highs in 2024 once the fed pivots. Going into 2028 you will see gold continue to break records. The 2028 election will all be about the defecit and the debt. We won't make it to the 2030's without cutting spending, 100% of all tax receipts will go towards interest on the $46 trillion debt in 2028.
For now, Gold bulls just keep your toes in, if you're out, stay out. Wait for the micro indicators to turn around, a sustained GDX about 30 would be a good indicator.
Banks are shorting the SH ** out of gold so just be careful, but the inevitable is coming.

GDX Put credit spread at -1 sigymbol GDX
Open Date 11/9/2023
Put or Call Put
Expiry Date 12/22/2023
Short Strike 25
Long Strike 24
Price to Open 0.12
Min Width Multiple 2
Risk Ratio 7.33
Return on Risk 13.6%
Opening DTE 43
1 Day ROI% 0.32%
Max Annual ROI % 115.8%
GDX hit a -2 sig on the weekly timeframe back on Oct 4/5 just like a lot of stuff did.
Pushed up and took out the previous bearish selling range, dipping into the gap range sellside liquidity above Grey box.
Becaue it made such a V bottom and left so many 4h gaps, running over and through the bearish opposing gaps I think probabilities shift to Bullish continuation.
Also, the fact that it pushed back INTO the weekly VA in Blue and held there for about a month makes me think the liquidity is Higher and it's reaching for it.
This is a textbook setup for me, anticipating a -1 sig pullback and then the pricing algo steps in to push higher.
The morning open saw the dive down to engage a buyer, then pushed away for a few hours, then I entered on the first 5 min pullback.
However, the level doesn't seem to hold this morning and it's hunting for liquidity below on a gap down today.
Chose the 25 short strike as it's about 2.5 sig the expected excursion from the entry -1 sig.
I may sell more at the 24 strike if 26.60 is tested at -2 sig.
Right now, I anticipate the weekly -2 sig selling level in Green near 25.60 will cause a buying bounce, if not the Daily/4h buying at the Blue line -2 sig doesn't step in before.
This is all happening after Powell speech yesterday afternoon and the QQQ just keeps extending higher reaching for some sellside liquidity.


ZZ + Flat + Contracting triangle ( WXY)The straight climb from Jan to July 2016 has been labelled by many EW analysts as wave 1 and the drop to 16 usd on Mar 2020 (during the covid period) as wave 2. I will, nonetheless, label them as wave W and X respectively as depicted in my chart.
Wave W as a zigzag, wave X as flat (ABC), with wave B of X as an expanding flat. Using the rule of alteration, wave Y will be a triangle. As shown in the chart, wave e of a contracting triangle is trending.
A breakdown below the bd trendline of the contracting triangle will be a first sign of a reversal.

GDX Long 11/29/23AMEX:GDX
The impulsive break of the wave (i) of ((c)) high of 30.16 indicates the continuation of trend higher through 32.92 and 36.26. Downside should remain corrective against the wave (ii) of ((c)) low of 27.02.

Gold - what the heck?Gold made a brief New All time high before getting smashed down.
This is the largest Daily Bearish engulfing candle gold has ever had.

GDX trade ideafollowing the break out in gold i focused on VANECK GOLD MINERS etf.
we all know how to play this set up... long already, will add on flag break out confirmation.

$GDX Bullish Chart Pattern The AMEX:GDX chart is currently exhibiting a bullish pattern, characterized by an inverse head and shoulders formation, a key technical analysis indicator. This pattern typically suggests a potential reversal of the prior downward trend, indicating a likely upward movement in price. An inverse head and shoulders pattern is a notable formation in technical analysis, often signaling a potential bullish trend reversal. This pattern typically appears after a downtrend and is characterized by three troughs: the left shoulder, the head, and the right shoulder. The head is the lowest point, and the shoulders are slightly higher but relatively equal in depth.
The pattern is completed with a neckline, drawn by connecting the high points of the two peaks located between the head and shoulders. A decisive breakout above this neckline is considered a confirmation of the pattern. This breakout often occurs with increased trading volume, adding validity to the potential trend reversal.
Traders and investors usually view the inverse head and shoulders as a sign of a shifting momentum from bearish to bullish. The price target post-breakout is often estimated by measuring the distance from the head's lowest point to the neckline and projecting this distance upwards from the point of breakout. However, it's important to consider other market factors and indicators alongside this pattern for a more comprehensive analysis.

Gold Miners ETF (GDX) Should Continue to Extend HigherShort Term Elliott Wave in Gold Miners Junior (GDX) suggests rally from 11.10.2023 low is in progress as a 5 waves impulse. Up from 11.10.2023 low, wave ((i)) ended at 29.07 as the 1 hour chart below shows. Dips in wave (ii) unfolded as a zigzag Elliott Wave structure. Down from wave ((i)), wave (a) ended at 28.38 and wave (b) rally ended at 28.75. Wave (c) lower ended at 27.98 which completed wave ((ii)) in higher degree.
The ETF then extends higher in wave ((iii)). Up from wave ((ii)), wave (i) ended at 29.6. Wave (ii) ended as a zigzag structure in lesser degree. Down from wave (i), wave a ended at 29.18, wave b ended at 29.47, and wave c ended at 29.01. This completed wave (ii) in higher degree. The ETF then extends higher again in wave (iii). Up from wave (ii), wave i ended at 29.87 and pullback in wave ii ended at 29.46. Expect the ETF to rally a bit higher to end wave iii, then it should pullback in wave iv to correct cycle from 11.28.2023 low before it resumes higher. Near term, as far as pivot at 27.98 low stays intact, expect dips to find support in 3 ,7, or 11 swing for further upside.


GDX: Bullish Inverse Head and Shoulders Bottom In PlayGold is up an even 10% year to date. The precious metal has frustrated bulls at times in 2023 but falling real interest rates over the past several weeks have undoubtedly been a boon. While it’s encouraging to see spot gold climb above the $2000 per ounce mark, I see potential upside in the VanEck Gold Miners ETF (GDX).
Notice in the chart that the portfolio of gold mining companies, Newmont Mining (NEM) being the biggest weight, is working on a bullish inverse head and shoulders bottom formation. I see a key neckline around the $30 mark while the low under $26 from early October represents the head. If we project that $4.50 height onto the neckline, then an upside measured move price objective to near $34.50 would be in play.
Something to watch heading into year-end is how the US Dollar Index performs. Surely a move toward 4% on the 10-year Treasury Note rate would be a macro tailwind for gold and the gold miners, but a drop under 100 might also help commodities writ large. What could cause such a combination of lower rates and a weaker greenback? Softer economic data, including a weak payrolls report due out on Friday, December 8, might be such a catalyst. As it stands, four rate cuts are priced into next year which offers a solid backdrop for precious metals heading into 2024.

Bullish Technicals point towards a potential ~ 16% rally in $GDX- Head and shoulders bottom
- Break of a significant down trend line
*(the information created and published on TradingView is not prohibited, doesn't constitute investment advice, and isn't created solely for qualified investors.)

$GDX Bull Flag Poised to Break OutThe AMEX:GDX , a notable gold miners ETF, is currently displaying a Bull Flag formation, indicating a potential breakout on the horizon. My perspective remains that we are on the cusp of a significant breakout, one that could not only impact the gold market substantially but also trigger an even larger movement in mining stocks. Admittedly, I've held this view for some time, akin to the old saying that "a watched pot never boils," suggesting that sometimes anticipation can make the wait feel longer. By mentioning this, I might be tempting fate with the market, yet I believe that this breakout could occur unexpectedly, perhaps when it's least anticipated by most investors.

GDX Head and Shoulder Neckline TestGold has been on a tear recently.
If gold breaks above and finishes above 2k next week, we should see GDX break the neckline at 30.
Target should be around 34 but there is heavy resistance at around 32.20 so that should be a nice area to take some chips off the table

Gold Miners ETF (GDX) Looking to End Zigzag CorrectionShort term Elliott Wave view in Gold Miners ETF (GDX) suggests the ETF is correcting cycle from 10.4.2023 low. Rally from 10.4.2023 low ended wave (1) at 30.16. Pullback in wave (2) is unfolding as a zigzag Elliott Wave structure. Down from wave (1), wave A ended at 27.61 as a diagonal. Rally in wave B ended at 29.81 as another zigzag in lesser degree. Up from wave A, wave ((a)) ended at 28.48 and dips in wave ((b)) ended at 27.90 Final leg wave ((c)) ended at 29.81 which completed wave B.
Wave C lower is currently in progress as a 5 waves impulse. Down from wave B, wave (i) ended at 29.18 and wave (ii) ended at 29.55. Wave (iii) lower ended at 28.54, wave (iv) ended at 29.15, and wave (v) lower ended at 28.11 which completed wave ((i)). Rally in wave ((ii)) ended at 28.64. The ETF then turned lower in wave ((iii)). Down from wave ((ii)), wave (i) ended at 28.17 and wave (ii) ended at 28.43. Near term, as far as pivot at 29.81 high stays intact, expect further downside in the ETF. Potential target lower is 100% – 161.8% Fibonacci extension from 10.20.2023 high which comes at 25.74 – 27.29.

GDX putting in a bottom? Watch GDX and GDXJ. If GLD can make ALL TIME HIGHS there's going to be a big move!

GDX looks upward to decision pointThe rally in GDX (daily chart) sees the price eyeballing the 200 day moving average and a decision point about whether to break the corrective downtrend from May's double top.
There are downside gaps from November, 2022 and October, 2023. But these do not need to fill any time soon. Watch the SMA 200.

Metals and MinersBullish setups galore with one more low possible before the bigger move up. Worth watching all of these for a long term (swing) trade.

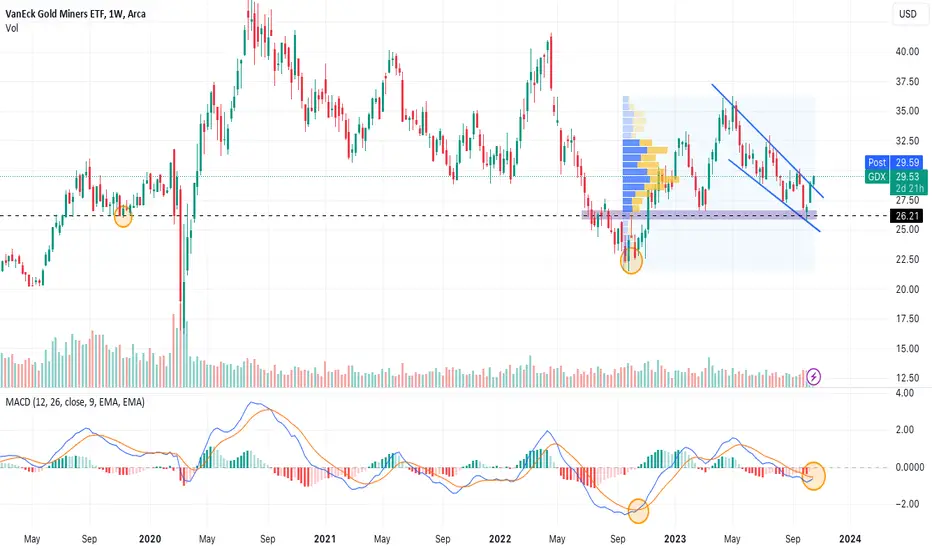
#GDX Reversal? AMEX:GDX The Vaneck Gold Miners ETF has notably developed as Long as it breaks out of a previously established downward channel on the weekly chart. This upward movement finds support at the year's initial lows of $26, which also corresponds with the pre-COVID lows. This resurgence is further validated by the presence of a bullish MACD crossover, adding a bullish momentum signal to the analysis.
#VaneckGoldMinersETF #BullishTrend #MACDIndicator #PreciousMetals
$GDX Trend Line Break AMEX:GDX Trend Line Break, echnical breakout in the chart of AMEX:GDX , which is an ETF that tracks the performance of companies involved in the gold mining industry.
A "Down Trend Line Break" to the upside is typically seen as a bullish signal in technical analysis. It indicates that the security in question, in this case AMEX:GDX , has broken through a declining trend line, suggesting a potential reversal or change in the prevailing downtrend.

Bright future ahead for gold and silver minersAs long as the price holds recent Oct lows, I will continue to expect it to move towards next important resistance area: 31-35-38.
Afterwards it would be ideal for price to consolidate and form a handle part of the cup with later break out above 35 pivot to confirm its intentions to move to next important resistance areas: 43-48-52
Short-term trading thesis: I will wait for price to consolidate around prior highs (preferably 29-30), providing a low risk entry point to consider any long trades.
Long-term trading thesis: Establishing a position within this potential basing periods along the right side of the cup with later breakout - all these looks reasonable for me for any positive expectations in coming months and 2024.
Important notice: Elliot waves and fibonacci retracements are a very subjective form of analysis and I don't personally trade out of them. I use them only for the purpose of gauging structural potential of any assets, that allows me to put more confidence when low-risk trading set-up emerges. Analysis and opinion doesn't pay, only price pays.
