GDX GOLD MINERS SET TO SPIKE NEXT WEEK ONCE AGAIN.Stock market weakness and trade tensions should help fuel the rally In Gold and indeed even more so they Gold Miners.(gdx)
Target price $32
GDX trade ideas

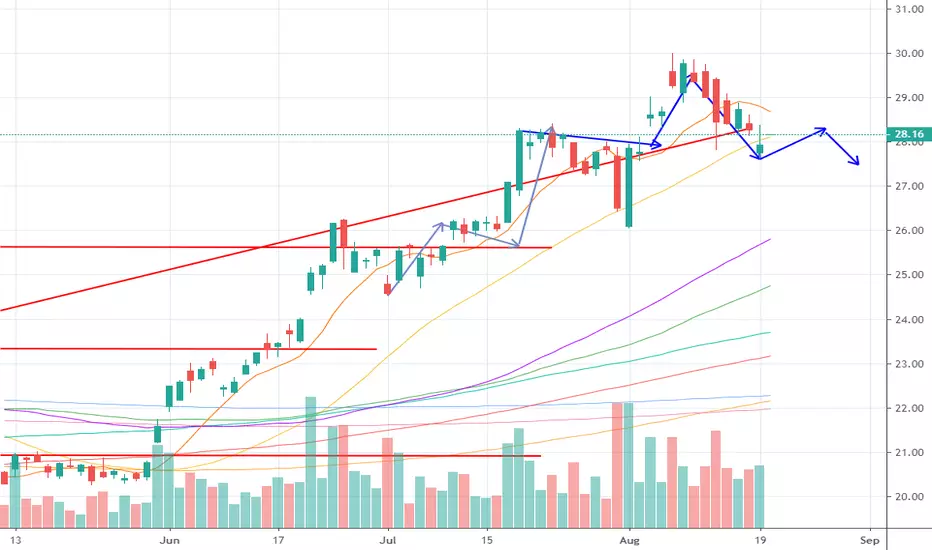
GDX likely to see another leg higherGDX held 27.8 and went back above 28.2. Even though still in the box, daily and weekly shows a good odds to continue upside move tomorrow and the day after. Did not see the golden 10ma weekly touch to load more.
Control size though.

Daily GDX stock trend forecast19-Aug
pretiming analysis
1. Recommended Positions
=> Neutral-Bullish
2. Price target within 10 days in the future
Stock price: 28.44 ~ 28.60
% Change: 1.84% ~ 2.39%
3. Investing section
=> In Falling section of high risk & low profit
4. Supply-Demand(S&D) strength Trend
=> About to begin a rebounding trend as a downward trend gradually gives way to slowdown in falling and rises fluctuations
5. Today's S&D strength
=> Supply-Demand strength has changed to a strengthening selling flow when stock market opening.
6. Forecast Candlestick Color at tomorrow
=> RED Candlestick
7. Forecast Timing Chart of 10 days in the future
www.pretiming.com
8. Forecast Range % D+1 (C): 0.20%
(L) ~ (H) Range: -1.13% ~ 1.74%
9. %Average in case of rising (C): 0.99%
(L) ~ (H) Range: -0.65% ~ 1.61%
10. %Average in case of falling (C): -1.24%
(L) ~ (H) Range: -1.71% ~ 0.74%

Short term opportunityOn weekly, it showed a bearish engulfing but supported by 5ma. If it does touched 10ma and showed reversal on 4h or daily chart, would be great chance to play long.


GDX Sell SignalHey Guys,
Bearish engulfing candle on GDX weekly chart.
Entered into 1 put contract of NUGT expires in a couple weeks.
I wish there was more to say about this but thats about it. Once again I prefer higher volume but the way it is decreasing for last several sessions implies a reversal.
Thanks

GDX this weekFinally GDX showed some sign of exhaustion.
Support below are 28.17, 27.8, 27.2
Above 28.9 can go higher.


GDX plan for 8/6/2019Apparently my time off is not good and missed most of the crazy run last two days.
So for tomorrow, if GDX gapped down and failed to close above 28.6 will make it a bit bearish on daily. Ideally we should see price supported by 28.13 and end up tomorrow with a long tail. Xau 4h printed a bearish engulfing. A little cautious and need to review again tmr morning.
Gap up to 29 will be pretty nice and 29 will be support for continued higher. Would play a bit aggressive in this case.
I would think ~50% chance will be range traded in 28.1 to 28.6. Will not play big here.
Otherwise, no interest to short at the moment.

GDX gap again?I know it is 9 waves from the low. But if it holds 28.9 level, it is a gapper for me tomorrow.

GDX Under-Performing Gold & HUI = Miners Anticipating Lower GoldGDX is still 12% below its 2016 highs, despite Gold having already surpassed its 2016 peak of 1375 by roughly 5%.
On top of this, the GDX having more exposure to unhedged miners should result in GDX out-performing the HUI hedged senior miners in a bull market. This is not the case, as the GDX is actually under-performing the HUI. Highest probability assessment is a retest $25 GDX.
Don't be like the many people who bought the "gold to the moon" hype in summer of 2016 and bought in at the highs and then subsequently got their a$$es handed to them.


GDX 7.31.19 PlanToday's action is not bad. Still leaning towards upside b/o. Can buy or sell when outside of triangle.


GDX: Time for buying PanicWith today's 24.80 at pre market, the ABC Correction should be seen as finished. Time for longs to return.

GDX - Possible breakout downwardsGDX broke out of the recent range to the downside. Could be a potential sustained downtrend in the short term.
Entered half position in $DUST so far, however have stop loss tight and waiting for further confirmation of the breakout strength before entering remaining position.

GDX Short to 24.50ishNeeds to close the gap from past run up and test new support around 24.50 then proceed to test resistance again.


GDX Wait for breakout
15 min chart: forming ascending triangle (consolidating)
Wait for the resistance breakout.

