Daily GDX trend prediction analysis19-JUL
www.pretiming.com
Investing position: In Rising section of high profit & low risk
S&D strength Trend: About to begin an adjustment trend as a upward trend gradually gives way to a slowdown in rises and falling fluctuations
Today's S&D strength Flow: Supply-Demand strength has changed to a strengthening selling flow when stock market opening.
Forecast D+1 Candlestick Color : GREEN Candlestick
%D+1 Range forecast: 1.4% (HIGH) ~ -0.9% (LOW), 0.8% (CLOSE)
%AVG in case of rising: 2.0% (HIGH) ~ -0.4% (LOW), 1.6% (CLOSE)
%AVG in case of falling: 0.6% (HIGH) ~ -1.4% (LOW), -0.6% (CLOSE)
GDX trade ideas

Gold miners relative to S&P500 20 RRR shortTrading Methodology:
1. An asymmetric bullish/bearish pennant is drawn using ascending and descending curved trend lines with a minimum of three price action touche points per line. The direction is determined by the previous trend.
2. The angle tool is applied from the earliest two trend touch points, beginning at the earliest touch point.
3. A trend-based Fibonacci retracement triangle is drawn starting from the earliest trend touch point and ending at the earliest touch point of the opposite trend line .
4. Based on the degree, of the earlier defined angle, the appropriate (and secret) levels are selected for the fibonacci retracement ; two levels for stop-loss and two levels for take-profit. The closest stop-loss level to the current price level is the top priority stop-loss. Though the secondary stop-loss level is often chosen for some markets such as FX and some equities in order to account for seldom unexpected resistance breaks. The greater target level is the top priority, and where majority of the shares are sold, though some may choose to close part of the position at the first target level or set it to be the stop-loss once price exceeds it. Entries should be laddered in around the levels closest of the yellow line.
This trading strategy can be applied to any market and time frame, and positions most often garner the greatest risk-to-reward ratio with the highest success rate. What more can you ask for? I will only be posting my unique trading strategy until EOY. I work solely with price action to identify pennants and apply unique trend-based fibonacci retracement levels for SL and TP levels. Reach out to me if you have any questions.

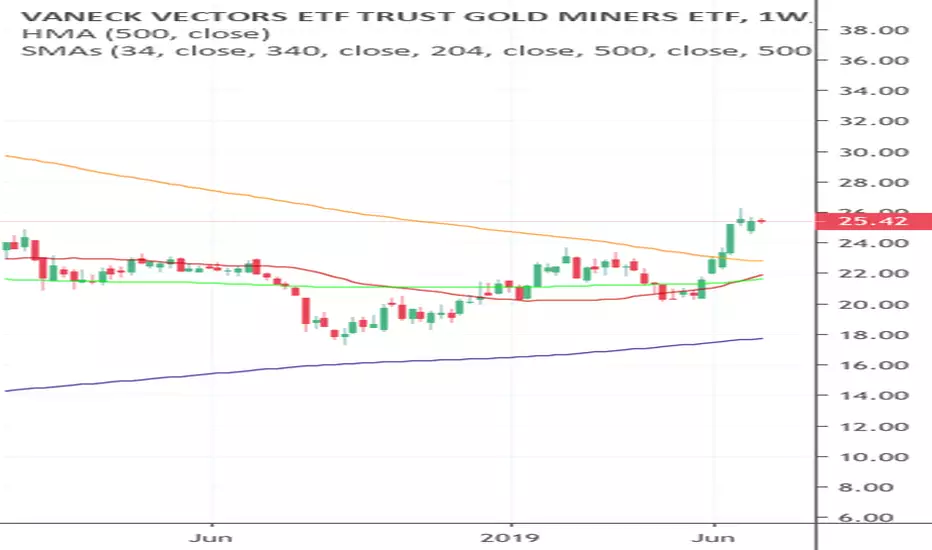
Everyone is bullish metals and miners....Everyone is bullish metals and miners, but looking at the fib levels on the weekly chart it looks like it needs to pull back to the lower fib level before it can go higher. $GDX, $NUGT, $DUST

Gold Miners - Catching the retrace downWelcome back guys! Sorry for the inactivity over the last few months, personal life has been quite busy. I should be posting regularly from now on so stay tuned!
*Please see comments for supporting charts*
Gold has gone into a consolidation period after making its massive run up, we should expect to see it trading within the symmetrical triangle for the near future. Right now it’s hard to tell whether the breakout from the triangle will be to the upside or downside, however I will go over several reasons why I think the downside scenario is more likely:
1.) Potential Bottom for Yields
a. The 10yr yields look to have potentially found its bottom. If this is the case, it’ll most likely consolidate around the bottom before making a run upwards, which will have a negative effect on gold.
b. If you look at how the 10yr chart, you’ll see that it recently broke out of a descending wedge pattern. This classic signal usually means a bullish sign, but we’ll have to see if the bottom can hold.
c. The bond market has been contradicting the equity market for a long time now, with bond prices soaring while stocks reach all-time highs. I think it may be time for bond investors to take some profits amid an economy that is still not showing any signs of a major recession.
2.) US Dollar Still Has Room To Run
a. The USD has been trading in a range for about 2 months now and it looks to be developing an inverse head and shoulder pattern within an uptrend.
b. If what the chart is telling us is right, then it means that the next breakout will likely be to the upside, which is also a negative for gold prices.
What does this mean for the miners?
The miners have clearly benefited from the increased gold prices, however they’re also trading in a range currently.
I’ve drawn out the possible paths that the miners could take based on what happens with gold, I’ve entered a small position in $DUST earlier today near the intraday high on $GDX. Will closely monitor the trade in case gold does breakout to the upside instead. I will also be looking to take profit near the first support ($25.08 on $GDX).

Just a idea as past repeat it selfI was looking at copper and silver . They are not following at all why. No inflation ?

Daily GDX stock forecast analysis for stock investing strategies03-Jul AMEX:GDX
Price trend forecast timing analysis based on pretiming algorithm of Supply-Demand(S&D) strength.
Investing position: In Rising section of high profit & low risk
S&D strength Trend: About to begin an upward trend as a adjustment trend gradually gives way to increasing limited falls and strong rises.
Today's S&D strength Flow: Supply-Demand(S&D) strength flow appropriate to the current trend.
read more: www.pretiming.com
D+1 Candlestick Color forecast: GREEN Candlestick
%D+1 Range forecast: 2.5% (HIGH) ~ 0.1% (LOW), 2.1% (CLOSE)
%AVG in case of rising: 1.9% (HIGH) ~ -0.4% (LOW), 1.5% (CLOSE)
%AVG in case of falling: 0.6% (HIGH) ~ -1.3% (LOW), -0.7% (CLOSE)

A big year ahead for gold minersGood day folks,
This is a comparison I made based on my GLD forecast for the next 12 months. I expect GLD to rise by 5 to 10% before year end. I calculated a few ratios and it appears that GDX moves exponentially with gold price (not a discovery I know). Basically, I wasn’t unable to use a distinct ratio, so I just compared their corresponding prices at the corresponding time.
I concluded that if GLD was raising by approx. 5-10% to my price target of 128 to 134.5, GDX would rise from 26.5 to 28. This is an upside potential of approximately 29 to 37% on the current price!
I am long.
Thank you,

Gold Miners Bullish This SpringThe Miners are getting pulled up by the Precious Metals in their Bear Market rallies. So the Gold Miners should out perform due to leverage on their balance sheets.
The price action is definitely corrective in nature, and the pull backs should be shallow because this is a small degree c-wave. So I'm expecting a top above the (a) wave over a year ago some time this Spring.
For a good video exploring whether to invest in mining stocks or the precious metals themselves, Mike Maloney has a well done video on the subject:
www.youtube.com
In fact I recommend spending time watching all of Mike Maloney’s videos on the PM’s and money. They are all well worth the time…

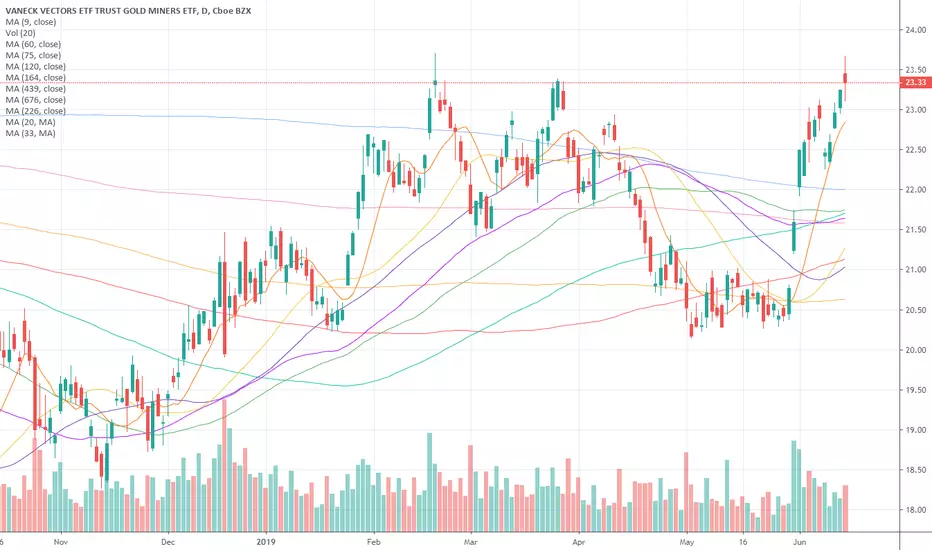
GDX Analysis: Bullish Move Not Yet Over?Conclusion for today’s GDX analysis: Price closing above 26.17 implies resumption of the current uptrend in GDX.
The VanEck Vectors Gold Miners ETF (GDX) is presented on the Daily timeframe with coverage of over 24 months of price action. The sell off and bearish market in the GDX that began in August of 2016 (not show here), continued until September 11, 2018 after which price failed to establish lower lows and lower highs.
A bullish trendline in GDX that has lasted over 9 months is used to highlight the current trend in the ETF ever since the September 11, 2018 price low of 17.28. The current bullish price swing from the last pivot on the trendline (at ~20.17) reached a peak of 26.17 where price is currently consolidating.
Horizontal lines of support are drawn on the chart where the ETF is expected to use a pivot to resume the bullish trend. They key levels therefore are 25.19, 24.56, 24.02, and 23.54.
The trajectory anticipated for price action is also provided. Failure of support at 23.54 increases the chances of price returning to the bullish trendline prior to resumption of the uptrend.

GDX: 30-31 Consider changing to Barrick Gold !!! It should start to outperform GDX and GDXJ.... Not yet sure if this year 35 ++ will be in.


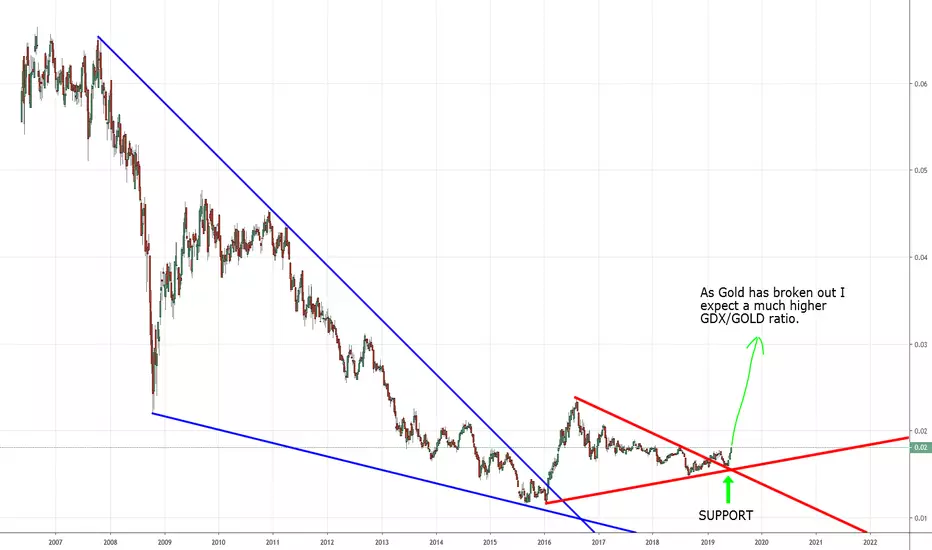
GDX/SPX
GOLD mining shares about to lift off?
Concerns: things to take in account
Iranian tensions in the market?
Us dollar weakning on talk of rate cuts in July?
World dollar shortage?
Increase in oil price sucking up dollar liquidity.
Chase to safety which will also increase the dollar price..
Gold and the dollar could both go up from here..
Needs to first break the first purple line /resistance and sat above it
Is silver failing to confirm the breakout?
Long Silver!

GDX monthly - breaks out and looks bullishRSI is in bullish zone, MACD is positive. Much more room to the upside (20% ~ 60%) but limited room to the downside (10% ~ 15%) so from risk/award perspective, it is attractive. I think it might spike fast from this level. IMHO it is a strong buy but do not forget a stop to shield down side risk.


GDX stock price forecast timing analysisStock investing strategies AMEX:GDX
Read more: www.pretiming.com
Investing position about Supply-Demand(S&D) strength: Strong buy as Rising section of high profit & low risk
Supply-Demand(S&D) strength linkage Trend Analysis: In the midst of an adjustment trend of downward direction box pattern stock price flow marked by limited rises and downward fluctuations.
Today's Supply-Demand(S&D) strength Flow: Supply-Demand strength has changed from a weak selling flow to a suddenly strengthening selling flow.
D+1 Candlestick Color forecast: GREEN Candlestick
%D+1 Range forecast: 0.2% (HIGH) ~ -0.4% (LOW), -0.1%(CLOSE)
%AVG in case of rising: 1.8% (HIGH) ~ -0.4% (LOW), 1.3% (CLOSE)
%AVG in case of falling: 0.5% (HIGH) ~ -1.3% (LOW), -0.8%(CLOSE)
Stock Price Forecast Timing Criteria: Stock price forecast timing is analyzed based on pretiming algorithm of Supply-Demand(S&D) strength.

Long Gold!Gold is breaking resistance levels in most indices.
With the probability of the fed cutting rates at almost 90%, Gold seems like a great option for a medium-term investment.

GDX going up....GDX (miners) looking for a strong move in a wave 3 towards 29-30, then a wave 4 pull back to finally hit the wave 5 box between 33-35. Looking good.....
