GDXJ trade ideas


GDXJ: Similar MEGA 100/200 WEEK MA Buy Signal!Especially since Trump favours weak USD to increase trade


GDXJ BreakoutGreat breakout here on GDXJ as investors fly to security with geopolitical instability.
We have a breakout of several different levels, making this a potentially very powerful break.
SIGNALS:
1. Breaking out of consolidation pattern since beginning of May
2. Breaking downtrend line from 2016 highs
3. Breaking over 200 day moving average
Entry: above 34
Target: former resistance around 42
Stop: under breakout level, 33.50 - 34.00
///
!! PM me with any questions about my analysis !!
MY TRADING METHOD:
I keep my analysis simple. Good analysis always is.
I use Price Patterns, Moving Averages, and RSI for my analysis.
I use the 1 day for trend analysis and 60 minute for trade entry
For my Targets I use Fibonacci projections + measured moves
Successful trading means proper risk sizing and trading small so you can stay in the game.

Short-term bullishness vs Long-term bearishnessStarting from big picture, my long term view for Gold, GDX (still in downtrend channel) doesn't change though we had a whole week of bull in Gold Miners!
Since 2011, GDXJ has been contained in downtrend channel like Gold. RSI indicator downtrend channel further enhance this fact. The picture does change abit when price hit channel bottom in Jun 2013 followed by another channel bottom in Dec 2013 to generate RSI bullish divergence. The attempt to move to channel top was rejected twice around 46.0 which was evidenced by the two failed break out in RSI. Subsequently, RSI uptrend line was broken and price continue its selling breaking below the ascending triangle.
RSI in 22 Sept 2014 shown a failed challenge to break above the uptrend channel(red region) thereby causing more vicious falls which happened to be a failure in support at 31. At this point volume is exceptionally showing 1st sign of despair in investors. Still price has not touched exactly the channel bottom, i can only anticipate that price will try to break 31.05 and if successful testing the resistance of ascending triangle as highlighted in the blue (also for RSI)
I would anticipate that ultimately if price fail either 31 or 37, it will fall into channel bottom around 18-19 in time to come with lesser volume showing that only pure smart money is in thereby creating yet another stronger bullish divergence in RSI

GDXJ: Bombastic long?An aggressive-speculative entry here could deliver amazing Risk vs Reward Opportunity.


2 Gaps UpThis 2 Gap-up seems to be a repeat pattern from early July... Will it have the same results? $JNUG $JDST $GDXJ $GDX $NUGT $XAUUSD $GLD

Market momentum changeGDX and GDXJ has been practically dead for a long time.
However, when the time is complete and most have fallen asleep, the party will start.
That time is likely to be now.
I'm ready for the party. Are you?

GDXJ is at critical junctionWe are at critical long term trendline. I believe it will break above in a strong move as we see PM's appreciating strongly


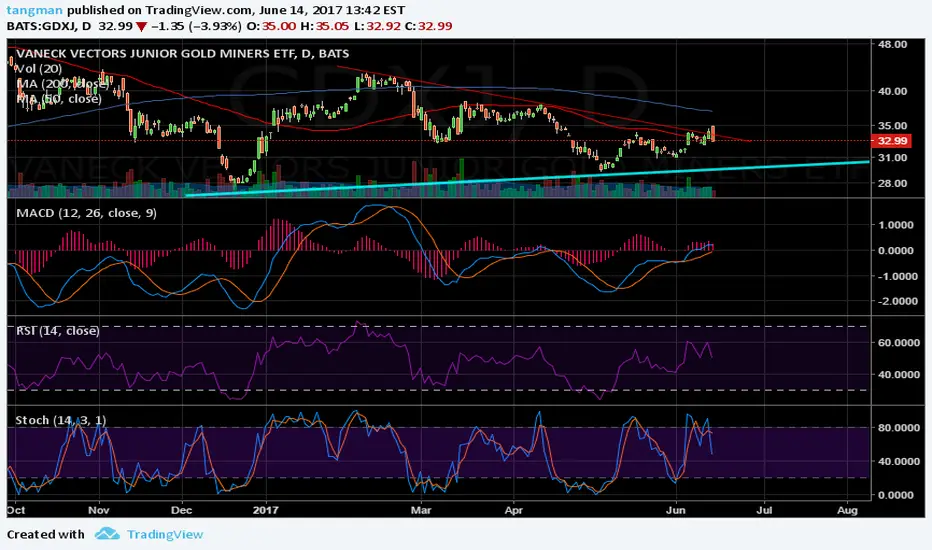
GDXJ at key crossroad - will 31.37 support hold?!GDXJ closed right above 31.37 support so guessing it will test it tomorrow but it'll have to break the long uptrend from its lowest point in Dec. 2015 to get there which makes this a key point for determining if long uptrend will be broken in line with shorter term downtrend. Either it breaks down & has a long way to fall or it bounces off either the long uptrend line around 31.5 or maybe the 31.37 support & moves up in resistance ranges. If it closes below both those levels tomorrow, Monday will either be start of real bloodbath or strong rebound per my reading of the above chart...either way, we're approaching the intersecting point of the long uptrend with the downtrend from high in Dec. 2016 so looks like big move coming either way!
Anybody with experience PLEASE share thoughts on how to hedge a big individual miner/precious metal allocation (currently at loss) if this breaks down over the coming days!! Still bullish long but def. want to reduce the bleeding if this falling knife is about to pick up speed!! THANK YOU! Til then, might keep cutting losses wth some riskier miners if it breaks levels above!

GDXJ Roll OverGDXJ appears to be at a short term tipping point and could be ready to roll over by the close of the day.
The PSAR is getting stretched and will flip in the next few hours as the bankers continue to pressure the bears exit their positions.
Still holding my short positions until next week.

Time to LONG Jr. Miners JNUGMiners have been beaten down due to the downside in metals recently, with UJ and XAUUSD at a good point for a probable turn around I am long JNUG in the 15's price tgt $20.

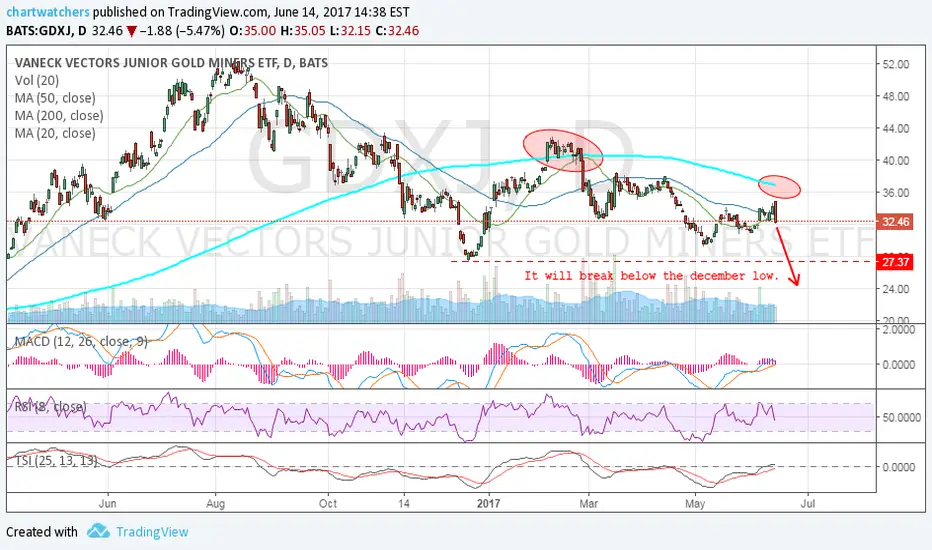
GDXJ - Freefall v2.0If gold is going down after a half year rally. What do you think the junior miners will do?
Yes they are going to fall too.
After an unsuccessful break above the 200 SMA it tried to tag it but couldn't even rise to the 200 SMA. And today we are turning down sharply .
I have to note that this cycle in the junior miners was extremely weak. Even weaker than the GDX cycle.
During the last few days banks were building a bull trap pulling in more and more traders onto the bull train.
GDXJ is going to break below the december low.

Gold Miners Down, JNUG down to 19.00, In Morning SessionGold prices are down to 1245 after hours. Historically, an after hours dip in gold prices will lead Gold Miners' Indexes JNUG NUGT GDX down. All three indexes were hitting top support at end of session on 6-28-2017. Sell immediately on open price, which will then plummet. Buy again near bottom of channel if gold prices stabilize. For JNUG that is around 19.00

The "I can't sleep trade" Shorting Junior MinersShorting juniors using long JDST. Trade will be invalid based on a daily close above the trend line.
Tips:
Don't use margin
Trade with what you can afford to lose
Expect extreme volatility
try to get some sleep ;)

GDXJ - Flag of surrenderWe are printing a flag here with an especially low volume on the last 2 days...
Sometimes next week it's going to break down. I was watching the chart today and noticed that on the 27th of February GDXJ lost all of its chance of going higher and printing a powerful intermediate cycle. It broke below the 100 EMA on high volume on that day. On the 15th of March it tried to regain the 100 EMA but failed.
So actually I think it was capped by a few big players in this whole IC... When gold is printing its first semester low in the following weeks GDXJ will give a unique opportunity for a few traders to load the trains with junior miners for the next decade.
When the technology bubble pops with these criptocurrencies these guys will be heading to gold's golden age with their horrible miner positions.
So I'm planning to collect some cash on this way down but sometimes this summer we will be buying our tickets to the miners bull train...
Till that time I'm holding my shorts.

Entered JDST with tight stop- Failed trendline break
- Bearish engulfing
- Possible ICL ahead for PMs
- Tight stop around today's Fed action.
Positions at 63.34, 65.26... tight stop. So far, made some lunch money.
I really believe GDX/GDXJ makes new lows into an ICL. However: Anything. Can. Happen.