SOLD GDXJ APRIL 31 23/31 SHORT STRANGLEAs with the XOP play, selling premium where the volatility is and that's in gold issues (GDX, GG, GDXJ) and oil (OIH, XOP) right now.
I filled this earlier today for a $98 credit.
The current metrics are:
Probability of Profit: 72%
Max Profit: $90 per contract
Buying Power Effect: Undefined
Notes: At the suggestion of FractalTrader (that you very much for your ideas, by the way), I'm playing around with what I can do graphically here with options setups, so that it's easier to visualize where price has to "sit" for the duration of the setup.
If you have traded options before, the vast majority of platforms display a range of prices horizontally, with prices below current price on the left, current price in the middle, and prices above current prices on the right, so it's a bit of a challenge to adapt an options platform view (which only consists of a horizontal "price axis") to a candlestick chart.
In any event, this is a short strangle, so I want price to remain between my two short option strikes for the duration of the trade -- above the 23 short put and below the 31 short call ... . I'll look to take the whole setup off at 50% max profit.
GDXJ trade ideas


GDXJ, WeeklyI know nothing of gold except what ZeroHedge tells me to think, but, boy, that's a lot of volume. Maybe time to ease in this or NUGT if you think an up trend is beginning.

Junior Gold Miners coiling in low vol p/back.$GDXJ has shown signs of accumulation since Q3 2014. See Excess Demand/Supply signals. It appears $GDXJ is getting ready to outperform $GDX Gold Miners etf (see chart shown below). $GC Gold futures also have shown accumulation. I am planning to leg in to the Juniors. To reduce risk I prefer to invest long in the Gold Miner etf's.

GDXJ Potential Short SetupThe Junior Gold Minors GDXJ finished a wave 3 down on the daily chart. It has now completed an abc correction into wave 4. The MTPredictor indicators generated a TS2 automatic sell signal at 27.14 with a stop at 29.77. The initial target is 21.99 which is the minimum wave 5 target. If price does not hit 27.14 (the entry) and instead moves above 29.77 first, then the trade is invalidated.
If the Swiss referendum fails, we may see further declines in these stocks.

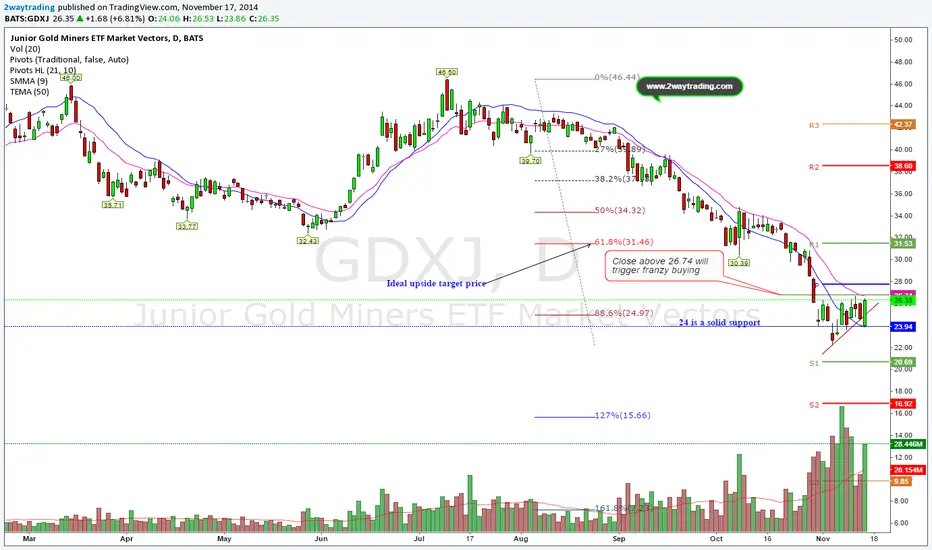
For every seller there is a buyer! Buyers have shown a forceRelative safe long position seems in the process with tight stop in case you are wrong. Let us meet $31 next few sessions if price manages to close above recent swing high at 26.74 we are not that far from it. If you want a real time alerts try us www.2waytrading.com
One to WatchGDXJ is coming off an important low on the weekly chart. MTPredictor found this abc correction and generated a long TS3 Trade setup. The initial resistance/target can be the DP off of the b swing at 44 with the final target at 46.59. Obviously, today's FED meeting can be a game changer so be aware. I decided to sell puts here instead of take the trade outright. It will be interesting to see how this one plays out.


GDXJ - follow up. GDXJ has been basically flat since I got in @ $40.25
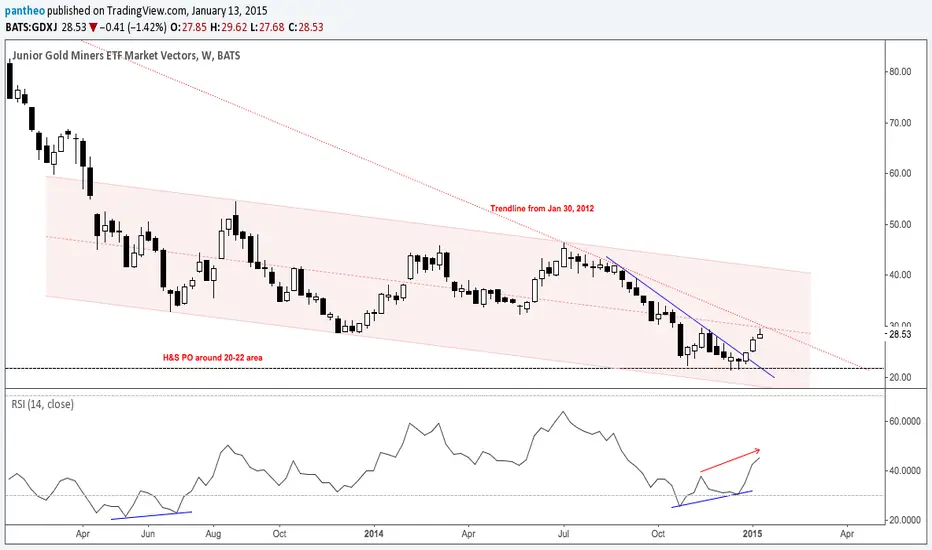
I still believe the golds are all making a large head and shoulders pattern. My only real fear is that maybe it is too obvious. Meaning that maybe it is becoming a crowed trade. In my experience it seems like the prettiest chart patterns tend to fail.
Another interesting thing I came upon is that it seems several Funds are taking interest in this ETF as well. In fact, according to
whalewisdom.com there has been increase of 36%. Compare this with SPY and QQQ which is 1% and -8% respectively.
Another interesting point of research is that gdxj and gld both have outperformed spy 80% of the time in Aug. Sep has under-performed.
stockcharts.com

GDXJ/GDX Ratio put a piercing line candleJuniors/Large producers ratio put a piercing line candle yesterday in the daily (not shown), right at the last weekly support/demand zone.
If confirmed, might be a good signal that Gold has a chance to go higher like the last time it happened and fight the outside weekly reversal which is an ominous sign on its own.
A close above 1,52 in the ratio will be good for the IH&S structure that exists both in miners and gold, hinting that 1,59-1,62 area is achievable.
Bear in mind, that both are still in a downtrend and last week's sentiment data does not yet reached pessimistic levels, while public opinion in Gold is at medium to low level and not yet in extreme negative zone. GOFO rates are negative for the last few weeks, always a good sign for PM complex longs.

Junior Gold Miners Update!I see a negated trend line and a broken upper resistance line now acting as support
due to the back test and now an up move... should be heading to structural resistance area.
But as always time will show
Safe trading ladies and gent!s!
BM

I didn't mean to turn you on!Junior Gold Miners ETF have been bitten up or rather down for the last 3 years.
In this process it has completed a huge ABCD at the purple line in 32.44.
At the end it has created a smaller shs pattern.... but target hasn't been reached so far at yellow line 15.75 (lowest is red line 28.97) and neckline is now being challenged. Is it a backtest or .....?
Speculative:
At a move and close above neckline for 2-3 consecutive days the shs pattern will be negated and I will be bullish. ;)
If above pans out I see a 0.236 retrace of the complete purple ABCD move for a good beginning.
I see the complete ABCD move being finished and with price above purple line ....it could be very bullish ;)
Music at work:
open.spotify.com
www.youtube.com
Extra: www.youtube.com (Like the bass)
But as always.... time will show
Safe trading ladies and gents!
BM

GDXJSome support on the ratio chart vs. SPY (false breakdown could be a good sign). Long above VStop on the daily chart.

Long $GDXJUpcoming demand, write downs in the rearview, terrible sentiment on raw good and industry, low risk given sitting on lows... I'll hold here for a few quarters barring a sudden drop below 30

Terrible Sentiment with Earnings PotentialUpcoming demand, writedowns in the rearview, terrible sentiment on raw good and industry, low risk given sitting on lows... I'll hold here for a few quarters barring a sudden drop below 30
