2021-08-28 GDXJ - supportPrice is still hovering at support. Last week had a nice bounce. Looking for bullish pattern to emerge on daily chart
GDXJ trade ideas

GDXJ - LongReasons for going long is the price is likely to go up, so by going long I am likely to make a profit because I will be able to sell it for more than what I bought it when I close the position that I longed.
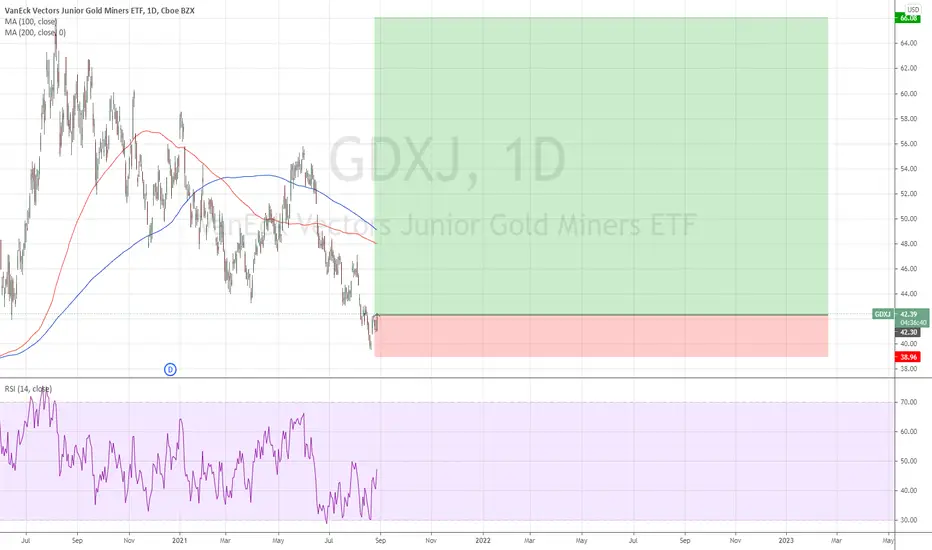
Bearish GDXJTrendlines : Downtrend lines in place. Until they break, appears to be headed much lower.
Support/Resistance : $41.93-$43.24 support area broken.
Moving Averages : Below all major MA’s: EMA 9, SMA 20, 50, 100, 200.
Chart looks like death. Bearish unless shorter-term downtrend line breaks. $35 price target.
GDXJ will lead Gold lower.

GDXJ double bottom - could this be the reversal?Double bottom price action on the GDXJ
Price of the double bottom also hitting S/R zone of the previous 4 year base break-out.
Does this indicate a reversal in the last 12 month pull-back and the start of a new break-out?


Buying GDXJ at Support with $51 Price TargetI'm looking for this support to hold and provide GDXJ with a 15% bump back up to the $51 region.
There's a clear invalidation level just under $43 to provide a tight stop-loss and 5.6 R/R ratio.
This trade could take anywhere from 2-6 weeks to play out. Be patient and let it come to you.
The idea with this trade is simple. Buy at support and Sell at resistance.


GDXJ back to $50! Potential short term double-bottom in for GDXJ. Target $50 at 200 MA and gap, set tight stop at $42.83. >5:1 reward/risk potential.


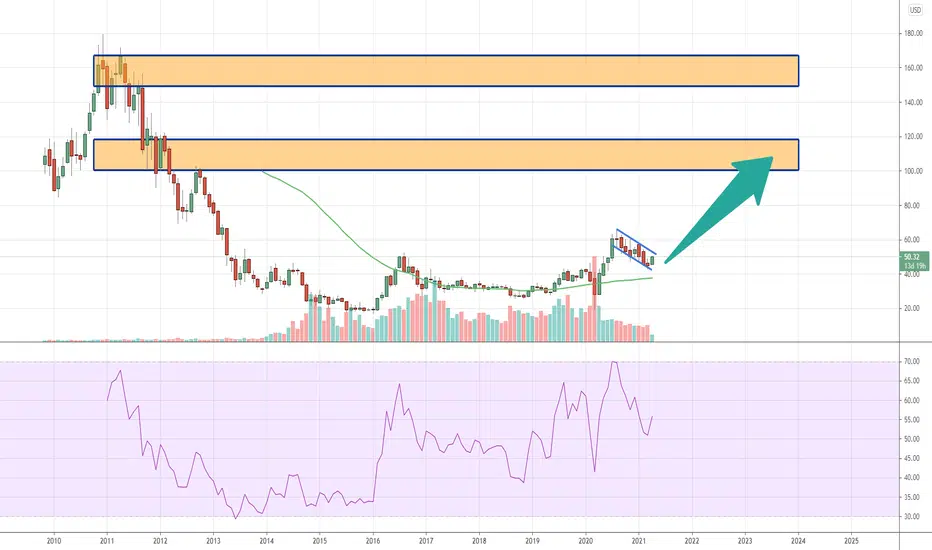
GDXJ Arc indicates low risk entry with 250% upside The fun side of the arc in the junior miners is currently playing out. At the moment, we reside at the edge of the arc, which presents a very low risk high reward entry. Completion of the arc would indicate a gain of around 250% + overshoot, in an 18 months timeframe.

Metals could be bottoming - Inverse H&SNot the strongest looking set up because of the dollar strength but a bottoming pattern could be developing. 1750-1760 should hold if this is the pattern. Buy on any dips that do no violate the neckline


2021-06-22 GDXJ - support levelHugging the arc at a significant support level.
Let's hope this holds

GDXJ and SLVP Wyckoff Accumulation Pattern Study.This is my first time doing this, it really looks like the text book accumulation is happening here.

GDXJ Bullish RetestIf we get a hammer or bullish engulfing at the retest, I will be going long.
**Just my analysis and not financial advice


GDXJ dont miss this opportunity Time to long gold miners. This basket will double. You want to be in this breakout.
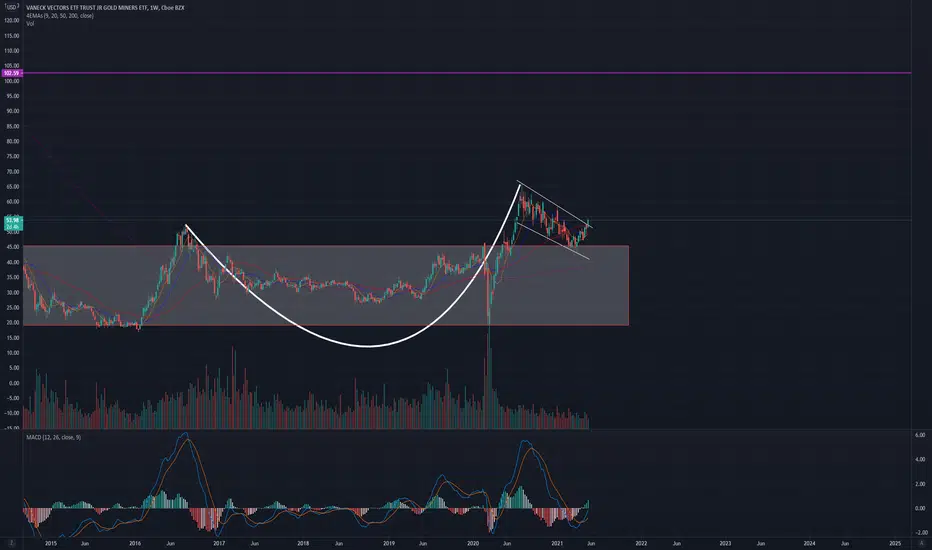
GDXJChart pattern: Bull flag
Entry: Aggressive traders can enter the trade immediately as the price closed above the downtrend line. Otherwise a closing price above 54.56$ in combination with a high volume on the daily chart can be used as a more confirmed entry
Stop: 43$
Target: ~90$
Stopmanagement: SAR Parabolic weekly chart default settings


HOLDING THE RAIL THUS FAR - Still a hold or buyUptrend in track today thus far. Watch/hold and or buy at the rail.


GDXJBullish megaphone pattern on RSI. Also breaking out attempt on a parallel rail. Need to confirm a breakout on Monday.

GDXJ - Bull Flag Forming on the Monthly If this bull flag breaks to the upside, Junior Gold Miners could double!
NFA, DYODD