$GLD vs $QQQ Monthlymuch different situation here than GLD vs SPY in the previous chart. None the less seems to be at a relative bottom. GLD needs to have a positive month, otherwise might signal nasdaq break out based on this chart.
GLD trade ideas

GLD vs. SPY Monthly chartSimilar wedge to 2016, we may have more strength behind the bullish thesis now especially with that volume spike $GDX $GLD $SPY $QQQ
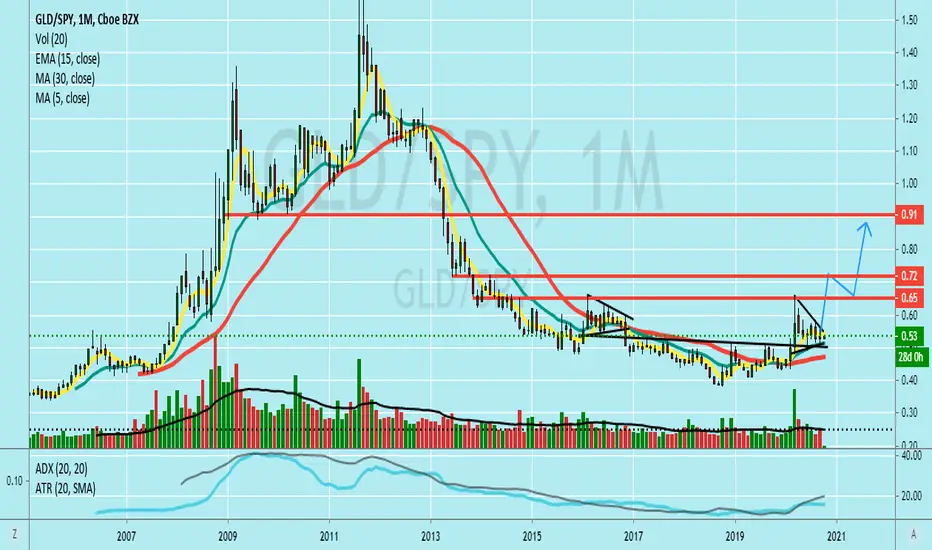
38 days until election, GLD / SPYGLD / SPY has been pretty accurate for TA predicting large moves, bottoms in the market & tops in the market (using traditional support & resistance the bottom was put in to the penny on a resistance line). With this inverse correlation and the forming of a wedge we’re gonna be in for a HUGE move near or after the election, best to get your positions in sooner rather than later.
I’m That is all good luck, like if this interests you.

Long Options Trading: GLD Buy Call $181.5 Exp: 10/09Understanding The trade:
As an options trader my goal is to identify trend change and utilize a breakout strategy to leverage profit off of major trend changes with minimal risk. Even though this contract does not expire till 10/09 I will be looking to take profit by October 6th as the rate of decay factor starts to come into play as the contract approaches expiry. This should correlate nicely with the downward sloping trend that has been resistance since August 17th. If you have any questions, please feel free to comment below and follow. Thank you and trade safe.
Reasons For Trade:
• Following upward trending channel
• Weakness in the USD Dollar after Trump announces he and his wife have COVID-19
• RSI validation on rejection of a break lower
Trade Parameters:
• Broker: Robinhood
• Cost For Entry: Free
• Contracts: 1
• Entry Price: .69
• Risk: $69
• Reward: $138
• ROI: 100%
• Risk/Reward Ratio: 1:1

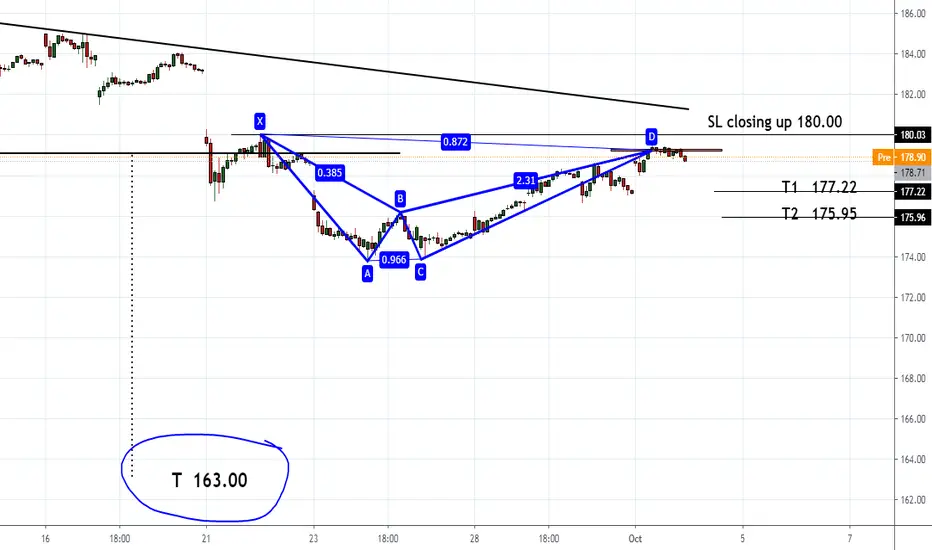
30m chart sell around 179.25
T1 177.22
T2 175.95
SL closing up 180
( on 4h chart the target is 163.00)

The Metals are looking HEAVY - Getting Long GLD Again2H chart in GLD fires off an Extreme Turn Buy at 175. Targeting visible range POC 183 area.
GLD OCT 177/183 Bull Call 1.70db
As always, we keep the management of directional options simple:
Risk = 50% of premium paid
Target = 2x Risk

[Long] Gold putting in a significant bottom.It's just crazy how bullish on Gold every "smart person" that I read is. Many many smart macro analysts and fund managers are long-term bullish Gold.
And yet here we are, technically oversold in a massive shakeout dip. What a gift.
I think Gold downside is very limited here. This is a great entry for a long term bull market.

GLD - Bullish Continuation / Botton of Channel / $175 Entry0. GLD at the bottom of the channel;
1. Descending Triangle / Bullish Contination;
2. Minimal downside;
3. $200+ Price target;


GLD is also simliarSome signs of a bounce on daily but weekly still looks bad. So avoid short term OTM bets.

GLD back to 170?Target: 170. What I see:
* short term descending triangle
* weak MACD almost going negative
* bearish flag on weekly charts
* DXY seems to have found support; may see a bounce with the recent market selloff into cash.
* needs to hold the ~~ 180 level which also happens to be near the 50 day moving average
looks like it is going to break through on the downside to me.

GLD LongGlD has started forming handle for a cup and handle pattern. Guys remember this is the last time GLD will be seen at that price. Bottom of the handle is what everyone needs to keep an eye on. When confirmed it is time to load and hedge against USD. Because as previously posted, today VIX has bounced heading up, USD is heading north and GLD and stocks are going down. Bonds slightly up too. Market is telling us something. Election debate will cause volatility but it is our only chance to let USD go and buy something else. Warren Buffett bought Barrick gold as a hedge against dollar. Because he believes in businesses and Barrick gold provides some dividends and price growth as gold rises so does the margin for miner. This is my opinion and not a financial advise. Please do not buy or sell any financial asset or any other asset reading this posts. These posts are for educational purposes.

$GLD Entered Breakout Mode from its descending triangle$GLD $GC_F Entered Breakout Mode from its descending triangle chart pattern. I posted about this development back on september 9th here. Close below support yesterday and followed through in a big way today. Price Target added to chart.
post from 09/10 here.

GLD Gold Trust updateSaw a different possibility of bottom in C ~174 that I wanted to mention. Still could see lower ~160 to 169.

GLD BullishArea's of consolidation around key mean levels (20 EMA) reduce risk and usually lead to bullish moves. No specific price targets.

$GLD Wedge Fake-Break LowThe first break of a range type formation is almost always a failure. This can be amplified even more if that fake-break goes against the larger trend which, in this case, it does. Buyers have a LOT of reasons to look for continuation up and a higher low would be a great ticket to the show.

Gold Trust GLD updateStill expecting another low in ~160 range. Watching for possibility that it has turned bullish. It looks better than SLV does off recent bottom.

GLD/SLV RatioWe have bounced a little as gold and silver have corrected from their summer highs. Traded down to the impulse leg target and the next leg down should be coming soon. Like SLV action over the past couple days. Bought hard off the $24.50 bottom yesterday and couldn't even get close today. It's coming.


Inflation + GLD ($GLD $DXY $Sil $SPY #Gold #SPY)see full chart & Follow at www.tradingview.com
A while back, you may see me call the top on Gold because it was up 25% in the last 12 months. while market was only 7%.
Some things have changed since then, Gold came back down a bit, The FED (FOMC & Powell) have declared they would let inflation run wild.
Interesting pattern on Gold, as market is starting to dip. we may get a slight bounce opportunity on GLD, as people panic and move into gld as hedge.
What's my play?
I will probably sell GLD puts at $179 to collect options premiums.
What's the significance of this?
KEY TAKEAWAYS About Gold
-Gold has long been considered a durable store of value and a hedge against inflation .
-Over the long run, however, both stocks and bonds have outperformed the price increase in gold , on average.
-Nevertheless, over certain shorter time spans, gold may come out ahead.
Gold vs. Stocks and Bonds
When evaluating the performance of gold as an investment over the long term, it really depends on the time period being analyzed. For example, over a 30-year period, stocks and bonds have outperformed gold , and over a 15-year period, gold has outperformed stocks and bonds.
