Gold royaltyI am following long diagonal trend line in the chart of GROY. There is some divergence in RSI, and support in the distance from MA. A company with good value and probable triple bottom.
With two new producing royalties from this year growth looks inevitable.
Do your own research!
GROY trade ideas

A way to find Historical BottomsWhen it comes to trading stocks, one of the most powerful skills you can develop is the ability to spot historical bottoms , those rare moments when a stock finishes its downtrend and starts a new upward journey. Catching these bottoms means entering trades with low risk and high reward potential , riding the wave of a new trend from the very beginning.
The Power of Double Bottoms
One of the most reliable chart patterns for identifying market bottoms is the Double Bottom. This pattern acts like a springboard for price, signaling that sellers are losing control and buyers are stepping in, showing a clear floor
Here’s how it works:
First Bottom : The stock drops to a new low, but then buyers push it up.
Second Bottom: After a short rally, the price falls again, often to a similar level as the first bottom , but this time, it doesn’t go lower. Buyers step in once more.
Breakout : When the price rises above the high point between the two bottoms, it confirms the pattern and suggests a new uptrend is beginning.
This structure creates a clear “floor” in the market, showing where demand outweighs supply. Traders love this setup because it gives a logical place to set stop-losses, keeping risk low.
Learning from the Chart
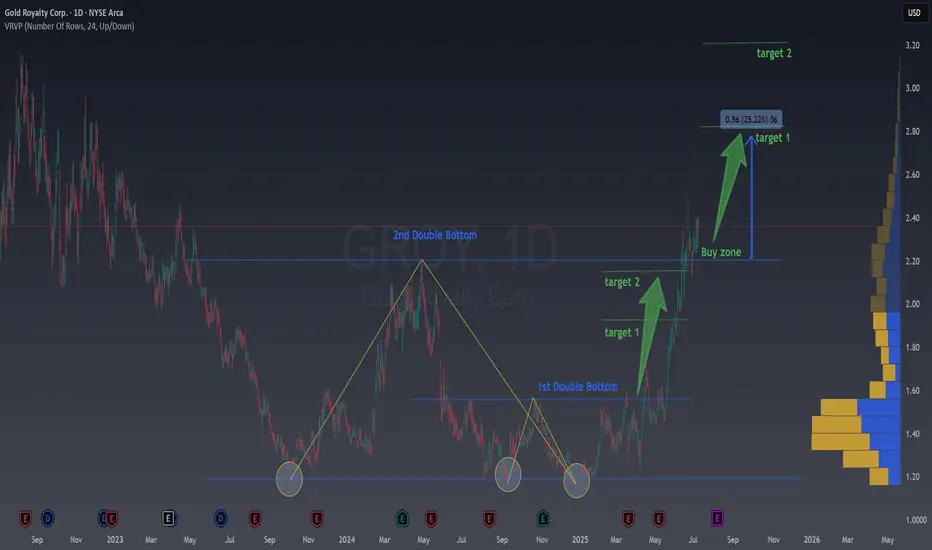
Let’s look at the provided chart of Gold Royalty Corp. (GROY) to see this in action. The chart highlights two Double Bottom patterns that formed over several months.
1st Double Bottom: Notice how the price hits a low, bounces, and then returns to the same area before bouncing again. This repeated support signals a strong bottom.
2nd Double Bottom: The pattern repeats, confirming even more buyers are entering at this level.
After these patterns form, the price breaks out above the resistance level (the high between the two bottoms). This breakout is often the ideal buy zone, the moment when a new trend is likely starting, and risk is minimized because your stop can be placed just below the recent lows.
Why Double Bottoms Work
Double Bottoms are powerful because they reflect real market psychology:
Capitulation : Sellers exhaust themselves on the first dip.
Testing : The second dip tests the market’s conviction, if buyers step in again, it’s a strong sign of a bottom.
Confirmation : The breakout above resistance confirms that demand is back in control.
How to Trade Double Bottoms
Here’s a simple, actionable approach:
Identify the Pattern : Look for two distinct lows at roughly the same price level, separated by a moderate rally.
Wait for Confirmation : Only enter when the price breaks above the high between the two bottoms.
Set Your Stop : Place your stop-loss just below some important local low or some fibo levels that we always share in our newsletter.
Target the Move: Use previous resistance levels or Fibo levels.
Example from the Chart
In the GROY chart, after the second Double Bottom, the price broke out and rallied strongly, hitting both target levels marked on the chart. Traders who entered at the breakout enjoyed a substantial move with limited downside.
Take away
Spotting Double Bottoms isn’t about predicting the future—it’s about reading the market’s story. By focusing on these patterns, you can find historical bottoms with confidence, enter trades with low risk, and position yourself to ride the next big trend. The best part? You don’t need to catch every bottom, just the clear, confirmed ones. That’s how you build consistency and success in trading.
If you’re new to chart patterns, start by looking for Double Bottoms on historical charts. Practice spotting them, and you’ll soon see how they can transform your trading approach.
GROY gives guidance LONGGROY does mine rentals as its business ( royalties) it collects rent in gold or gold ore. Business
has been good the recent earnings report was a beat with guidance for significant increases
in revenues in the near and intermediate term. Volume and price product ( PVT) is rising.
The MFI+RSI+ MOM shows all three measures as bullish. I will initiate another long trade here.
I have traded GROY in the past as seen good cause to take a position again. My target is 5
at the level of the neckline of the head and shoulders all time highs.

Gold GROY - long term playGold Royalty Corp. Investment Thesis
Company Overview:
Gold Royalty Corp. is a growth-oriented company focused on acquiring gold-focused royalty and mineral stream interests. It offers investors a unique proposition by providing exposure to gold with less operational risk compared to mining companies. The company's portfolio includes royalties on various stages of projects, from exploration to production, providing a diversified risk profile.
Financial Highlights and Risks:
Cash Position and Solvency: As of September 30, 2023, Gold Royalty reported cash and cash equivalents of $3.348 million, a decrease from $5.847 million at the end of 2022. This reduction in cash reserves necessitates a close watch on the company's ability to fund its operations and acquisitions without resorting to excessive debt or dilutive equity issuances.
Revenue and Profitability: For the nine months ended September 30, 2023, the company reported revenue of $2.032 million, a decrease from $3.411 million in the same period in 2022. This decline in revenue, coupled with a net loss of $7.396 million for the nine months ended September 30, 2023, underscores the challenges in maintaining profitability and growth in the volatile gold market.
Debt Levels: The bank loan increased significantly to $17.468 million as of September 30, 2023, from $9.448 million at the end of 2022. This increase in leverage raises concerns about the company's debt servicing capabilities, especially in a fluctuating gold price environment.
Asset Portfolio: The company's royalty and mineral interests grew to $672.824 million as of September 30, 2023, from $667.504 million at the end of 2022. This growth indicates ongoing investments in expanding the portfolio, which could yield future returns but also carries the risk of exposure to unproductive assets.
Market Stability and Gold Outlook:
The gold market is known for its volatility, influenced by global economic indicators, currency fluctuations, and geopolitical events. Gold Royalty Corp.'s performance is inherently tied to gold prices, which can be both a risk and an opportunity. The current global economic uncertainty and inflationary pressures could support higher gold prices, benefiting Gold Royalty's revenue from its interests.
Bullish vs Bearish Fundamentals:
Bullish Case: The bullish case for Gold Royalty Corp. hinges on rising gold prices, driven by economic uncertainty, inflation, and demand for safe-haven assets. The company's diversified portfolio of royalties and streams could provide leverage to gold prices without the operational risks associated with mining.
Bearish Case : On the bearish side, a significant downturn in gold prices could adversely affect the company's revenue and ability to finance its operations and debt. Additionally, the execution risk associated with expanding its portfolio and the potential for unproductive assets could weigh on performance.
Conclusion:
Investing in Gold Royalty Corp. presents an opportunity to gain exposure to gold with a diversified risk profile. However, potential investors must weigh the company's current financial position, including its cash reserves, profitability challenges, and increasing debt levels, against the backdrop of a volatile gold market. The bullish and bearish fundamentals outlined provide a balanced view for making an informed investment decision.
Key Considerations:
Monitor Gold Prices: Investors should closely monitor gold price trends and global economic indicators that influence gold demand.
Financial Health: Keep an eye on the company's cash flow, debt levels, and ability to finance its growth without excessive dilution.
Portfolio Performance: Assess the performance and potential of Gold Royalty's portfolio, focusing on projects nearing production that could contribute to revenue.
