GUSH in Buy ZoneMy trading plan is very simple.
I buy or sell when at three of these events happen:
* Price tags the top or bottom of parallel channel zones
* Money flow spikes beyond it's Bollinger Bands
* Stochastic Momentum Index (SMI) at near oversold overbought level
* Price at Fibonacci levels
So...
Here's why I'm picking this symbol to do the thing.
Price in buying zone at bottom of channels
Stochastic Momentum Index (SMI) at oversold level
Money flow momentum is spiked negative and under bottom of Bollinger Band
Entry at $21.94
Target is upper lower channel around $28
GUSH trade ideas

XOP To The Moon?As we have seen, XOP has struggled to maintain itself even with all of the middle east tensions going on. I still believe we will see a higher high soon enough. Patience is key. I am going to let the chart do its thing.

GUSH from $27.62 to $31MODs have suggested that I provide more detail about the picks I make.
Sorry. I'm not as verbose as y'all, and I don't like things to be complicated.
My trading plan is very simple.
I buy or sell at top & bottom of parallel channels.
I confirm when price hits Fibonacci levels.
Bonus if a TTM Squeeze in in play.
I hold until target is reached or end of year, when I can book a loss.
So...
Here's why I'm picking this symbol to do the thing.
Price at bottom of channel (period 39)
Stochastic Momentum Index (SMI) at oversold level
VBSM is negative
In at $27.62
Target is $31 or channel top
Stop loss is $26.50

Gush BULLISH on all higher time framesUsing some fib levels we notice that after this longe triangle breakout that gush retested the 50% fib line from the first pump. This is a solid sign that the oil and gas market is about to go up significantly. Drip just broke a parallel channel and is looking to hit the bottom of that downward wedge. All signs point to up.
Not financial advice <3
Entry: 36.46
Tp: 50.00


GAS started a jump; would OIL do the same?Last two weeks we saw a jump in the natural gas stocks and ETFs and the oil based stocks were ranging or had a jump (like BP).
This looks like a break out.
Never forget to put SL

5 hearts, is not enough? Y will update my play here, because this is huge now, like 50% exiting the bullish flag.

2 of 3 targetsToday we reached 2 of my 3 targets, lets see how china affects the OIL demand and other products from the refineries.
i like this for a sabe 13%, but...There is a huge bear flag after the end of the trend. i like more $DRIP for a 80%
GUSH Daily Perspective Fib & TrendlinesWe seem to have a double top forming at the 0.786 retracement level on this bearish Fibonacci. Will GUSH continue to lag behind USOIL and drive up one last time to fill the gap at $225.00 on a daily wick before moving downwards and catching up with USOIL?

GUSH Weekly Trend, Fib, & VWAPGUSH has been on an uptrend for 2 years and 8 months and has followed many Fibonacci sequences during that time. Will the bearish fib play out, reverse from the 0.786 zone at $210 and fulfill the -0.27 extension of $77.64? This would align perfectly with a bullish Fibonacci sequence drawn from the low in August 2021 to the high of June 2022. On the bullish fib, the retracement levels at 0.618 ($94.00) and 0.786 ($72.00) create a confluence with the bearish fib extension of -0.27 ($77.00).
Time will tell if the bearish fib chooses to play out. With one more leg lower on USOIL, sub $100 is definitely on the cards for GUSH.

HOMEWORK for Energy season OCT-AprilThe fund, under normal circumstances, invests at least 80% of its net assets in financial instruments, such as swap agreements, securities of the index, and ETFs that track the index and other financial instruments that provide daily leveraged exposure to the index or to ETFs that track the index. The index is designed to measure the performance of the oil and gas exploration and production sub-industry determined based on the Global Industry Classification Standards. The fund is non-diversified.
Do not trade "OPTION " 100% lose
Position is alway the best to control your profits
Position loading zone "STRATEGY", APPLy pattern strategy
VWAP , Double bottom base
Base lenght minimum of weeks
Base correction <50% from peak
pivot points breakout through middle of WEEK
Flate base
Base length Minimum of 5 weeks
Base correction <15%
Pivot point Left -side high of base
Double bottom base
Base length minimum of 7weeks
Base correction <50% from peak
Pivot point breakout through middle of week .
building a Position
when you buy a new stock , think about not commiting your entire position in one decision , instead , commit incrementttally making your stock prove it strenght by advancing in price , say your full position for a stock would be $500-1000 for your first position you could contribute $500 at the start and if the stock continues to advance add additional , smaller amounts until you've reach your full position .
My strategy technique is "Pyramiding" or "DCA", A"veraging Up" , "buy to cover ", because after a larger purchase , you make smaller one as the stock advance it important that you buy fewer shares with your second and third purchase to avoid running up your average cost , To aovid making follow up buys once the price of the stock is more than 5% above it pivot point
entry 1 50% price scale 2.5+5% entry loading zone points
entry 2 30% Price scale 2.5+5%
entry3 20% price scale 2.5+5%
A straegy for incrementally scalling into a position as price rise ..
Entry 2 "116"
entry 21 "95"
entr 3 "74"

$GUSH to $30 or soThe Fed has made it clear they need oil prices lower and they will continue to crush the market until we do something about it as traders.
In the Information Society we are no longer needing to control the masses through the tyranny of violence or the scarcity of resources. Its better to ensure we continue to grow globally.
The pyramid must continue to be built and gas is too damn high and thus demand has been destructed.

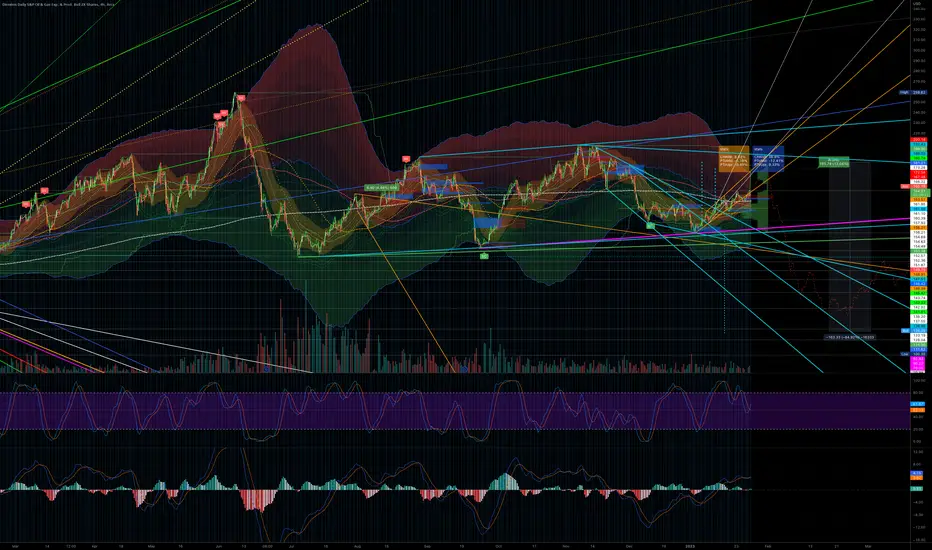
GUSH 8/19 expiryGUSH gapped up today ahead of 8/19 monthly options expiry. Here's a GUSH 2022 uptrend channel with a 5 day EMA envelope. As of right now, $179.40 is the next resistance and $119.60 is the main support.
Do your own due diligence, your risk is 100% your responsibility. This is for educational and entertainment purposes only. You win some or you learn some. Consider being charitable with some of your profit to help humankind. Good luck and happy trading friends...
*3x lucky 7s of trading*
7pt Trading compass:
Price action, entry/exit
Volume average/direction
Trend, patterns, momentum
Newsworthy current events
Revenue
Earnings
Balance sheet
7 Common mistakes:
+5% portfolio trades, capital risk management
Beware of analyst's motives
Emotions & Opinions
FOMO : bad timing, the market is ruthless, be shrewd
Lack of planning & discipline
Forgetting restraint
Obdurate repetitive errors, no adaptation
7 Important tools:
Trading View app!, Brokerage UI
Accurate indicators & settings
Wide screen monitor/s
Trading log (pencil & graph paper)
Big, organized desk
Reading books, playing chess
Sorted watch-list
Checkout my indicators:
Fibonacci VIP - volume
Fibonacci MA7 - price
pi RSI - trend momentum
TTC - trend channel
AlertiT - notification
tickerTracker - MFI Oscillator
www.tradingview.com

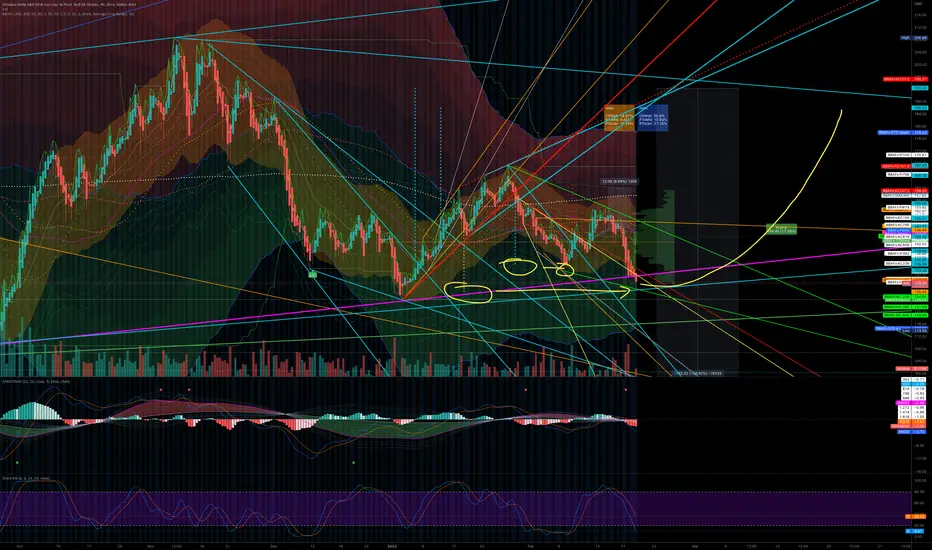
Fossil fuels / Commodities bubbleFossil fuels / Commodities bubble is about to pop. I'm starting to look for a bearish reversal within the next 2 weeks. Here's a GUSH 1 day chart with my indicators, pi RSI, tickerTracker, Fibonacci MA7, MTTC2.0 beta, Fibonacci VIP, ATRxxl beta and Volume & PivotsHL.
Do your own due diligence, your risk is 100% your responsibility. This is for educational and entertainment purposes only. You win some or you learn some. Consider being charitable with some of your profit to help humankind. Good luck and happy trading friends...
*3x lucky 7s of trading*
7pt Trading compass:
Price action, entry/exit
Volume average/direction
Trend, patterns, momentum
Newsworthy current events
Revenue
Earnings
Balance sheet
7 Common mistakes:
+5% portfolio trades, capital risk management
Beware of analyst's motives
Emotions & Opinions
FOMO : bad timing, the market is ruthless, be shrewd
Lack of planning & discipline
Forgetting restraint
Obdurate repetitive errors, no adaptation
7 Important tools:
Trading View app!, Brokerage UI
Accurate indicators & settings
Wide screen monitor/s
Trading log (pencil & graph paper)
Big, organized desk
Reading books, playing chess
Sorted watch-list
Checkout my indicators:
Fibonacci VIP - volume
Fibonacci MA7 - price
pi RSI - trend momentum
TTC - trend channel
AlertiT - notification
tickerTracker - MFI Oscillator
www.tradingview.com

Straddle - wait for flat trading day for amicable option premiumHi everyone, with the volatility we've seen in the energy sector, I think straddle can provide an excellent tool exploiting some of that unpredictability. Premiums on some ETFs and energy stocks can be pretty harsh, I would wait for a flat trading day and try to take advantage of the discounted option premiums to straddle. Be weary of the theta on these, if you're straddling, make sure you're watching the contracts closely. Not uncommon for some folks to make some money on both sides of the contract when things get this unpredictable.


GUSH bullish for swing trade$GUSH part of broadening ascending wedge. This pattern is a bearish, but it bounced off support (5/2/2022). I expect it to make a bull run to 200 - a previous high recently. Petro is tightening supplies and now there is talk of trucking crisis this summer. The volatility in equities, commodities, talk of war and russian santions make this something I would not hold long. Bear break below the support side of the wedge could be falling knife.

GushaliciousTheres a gap at 45.000 and on one at 58000, im in.
The amount of time it takes to restart oil production...
7 months for fracking
7 years for off shore drilling
a push for years on climate change and evs, now we may get gas cards from the government?
The MOASS could be oil.
In since 44, riding quite nicely on the MA's

$GUSH Target PT 300 and higherThe fund, under normal circumstances, invests at least 80% of its net assets in financial instruments, such as swap agreements, securities of the index, and ETFs that track the index and other financial instruments that provide daily leveraged exposure to the index or to ETFs that track the index. The index is designed to measure the performance of a sub-industry or group of sub-industries determined based on the Global Industry Classification Standards. The fund is non-diversified.

Macro-Economic Calendar watch 2/10Macro-Economic Calendar watch 2/10
7:00 OPEC Monthly Report
8:30 Continuing Jobless Claims Forecast: 1,615K Previous: 1,628K
8:30 Core CPI (MoM) (Jan) Forecast: 0.5% Previous: 0.6%
8:30 Core CPI (YoY) (Jan) Forecast: 5.9% Previous: 5.5%
8:30 Core CPI Index (Jan) Previous: 284.76
8:30 CPI (YoY) (Jan) Forecast: 7.3% Previous: 7.0%
8:30 CPI (MoM) (Jan) Forecast: 0.5% Previous: 0.6%
8:30 CPI Index, n.s.a. (Jan) Forecast: 280.39 Previous: 278.80
8:30 CPI Index, s.a (Jan) Previous: 280.13
8:30 CPI, n.s.a (MoM) (Jan) Previous: 0.31%
8:30 Initial Jobless Claims Forecast: 230K Previous: 238K
8:30 Jobless Claims 4-Week Avg. Previous: 255.00K
8:30 Real Earnings (MoM) (Jan) Previous: 0.1%
10:30 Natural Gas Storage Forecast: -222B Previous: -268B
11:00 Cleveland CPI (MoM) (Jan) Previous: 0.4%
11:30 4-Week Bill Auction Previous: 0.035%
11:30 8-Week Bill Auction Previous: 0.140%
1:00 30-Year Bond Auction Previous: 2.075%
2:00 Federal Budget Balance (Jan) Forecast: 25.0B Previous: -21.0B
Do your own due diligence, your risk is 100% your responsibility. This is for educational and entertainment purposes only. You win some or you learn some. Consider being charitable with some of your profit to help humankind. Good luck and happy trading friends...
*3x lucky 7s of trading*
7pt Trading compass:
Price action, entry/exit
Volume average/direction
Trend, patterns, momentum
Newsworthy current events
Revenue
Earnings
Balance sheet
7 Common mistakes:
+5% portfolio trades, capital risk management
Beware of analyst's motives
Emotions & Opinions
FOMO : bad timing, the market is ruthless, be shrewd
Lack of planning & discipline
Forgetting restraint
Obdurate repetitive errors, no adaptation
7 Important tools:
Trading View app!, Brokerage UI
Accurate indicators & settings
Wide screen monitor/s
Trading log (pencil & graph paper)
Big, organized desk
Reading books, playing chess
Sorted watch-list
Checkout my indicators:
Fibonacci VIP - volume
Fibonacci MA7 - price
pi RSI - trend momentum
TTC - trend channel
AlertiT - notification
tickerTracker - MFI Oscillator
www.tradingview.com

oil could resume the boom (GUSH)wti is still in a weekly uptrend, and that could mean bulll
ish business for GUSH.
i think every time we hit a bottom in monthly oil futures we experience a period of upside with extreme volatility until that pattern of lower weekly highs during reversal breaks on the daily.
we are just near treating VWMA as support.

Obvious trend continuesThe obvious bullish "Energy trend" continues since it's 12/20/21 low. Is the no brainer trade getting too easy? How long will this Energy uptrend continue? Well, it's all up to Wallstreet, underlying macro-economic factors and geopolitical events. Usually trends last about a month at a time but might as well stay on the bandwagon until the easy Energy trade reverses. Here's important levels on the 1 hour chart:
52 week high = $124
52 week low = $44.83
SMA200 = $94.99
SMA150 = $95.47
SMA100 = $100.63
SMA50 = $107.45
breakout = $128.64
R3 = $124.69
R2 = $120.74
R1 = $116.79
pivot = $112.84
S1 = $108.89
S2 = $104.94
S3 = $100.99
breakdown = $97.04
GUSH Holdings:
Dreyfus Government Cash Management Institutional Shs DGCXX 35.38%
Financial Square Treasury Instruments Fund FST Shares FTIXX 10.55%
Callon Petroleum Co ORD CPE 1.86%
Devon Energy Corp. DVN 1.81%
SM Energy Co. SM 1.77%
Diamondback Energy Inc. FANG 1.72%
APA Corp. APA 1.67%
Marathon Oil Corp. MRO 1.66%
EOG Resources Inc. EOG 1.57%
ConocoPhillips COP 1.52%
Murphy Oil Corp. MUR 1.49%
Ovintiv Inc. OVV 1.48%
Occidental Petroleum Corp. OXY 1.44%
Pioneer Natural Resources Co. PXD 1.43%
Chevron Corp. CVX 1.42%
Continental Resources Inc. CLR 1.39%
Range Resources Corp. RRC 1.37%
Matador Resources Co. MTDR 1.36%
PBF Energy Inc. PBF 1.34%
Exxon Mobil Corp. XOM 1.34%
Antero Resources Corp. AR 1.33%
Hess Corp. HES 1.33%
Coterra Energy Inc. CTRA 1.33%
HollyFrontier Corp. HFC 1.32%
Marathon Petroleum Corp. MPC 1.29%
Do your own due diligence, your risk is 100% your responsibility. This is for educational and entertainment purposes only. You win some or you learn some. Consider being charitable with some of your profit to help humankind. Good luck and happy trading friends...
*3x lucky 7s of trading*
7pt Trading compass:
Price action, entry/exit
Volume average/direction
Trend, patterns, momentum
Newsworthy current events
Revenue
Earnings
Balance sheet
7 Common mistakes:
+5% portfolio trades, capital risk management
Beware of analyst's motives
Emotions & Opinions
FOMO : bad timing, the market is ruthless, be shrewd
Lack of planning & discipline
Forgetting restraint
Obdurate repetitive errors, no adaptation
7 Important tools:
Trading View app!, Brokerage UI
Accurate indicators & settings
Wide screen monitor/s
Trading log (pencil & graph paper)
Big, organized desk
Reading books, playing chess
Sorted watch-list
Checkout my indicators:
Fibonacci VIP - volume
Fibonacci MA7 - price
pi RSI - trend momentum
TTC - trend channel
AlertiT - notification
tickerTracker - MFI Oscillator
www.tradingview.com
