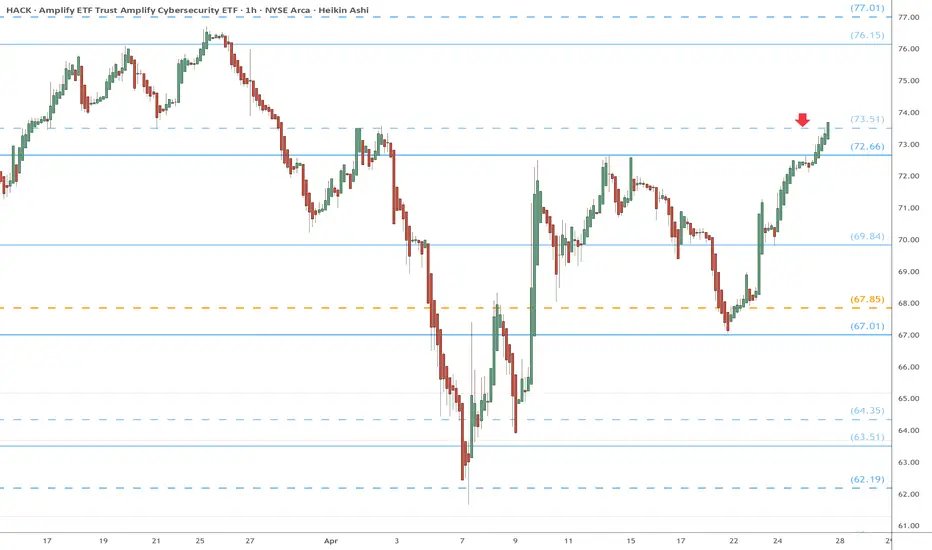
HACK eyes on $73.51: the last barrier to UpTrend resumptionHACK following Genesis and Covid fibs very well.
Just now trying to break the Covid fib at $73.51
But first it may well retest Genesis fib at $72.66
HACK trade ideas
$SMH vs $HACK: Recent good correlation with breakout potentialMany market watchers will say that Semis are the most important stocks in the market. Semis are great from a market direction perspective. They are the best to indicate a downturn and the fastest to recover during a bull run. In this blog we have appreciated the relative resilience of the Cybersecurity stocks during the recent bear market. The cybersecurity ETF AMEX:HACK fell only 25 % during the 2025 bear market. NASDAQ:SMH fell almost 40% and NASDAQ:SMH / AMEX:HACK fell 35% which indicated the relative underperformance of Semis vs Cybersecurity in April. But form the lows of ‘Liberation Day’ NASDAQ:SMH and AMEX:HACK are trading with perfect correlation. But the question comes will NASDAQ:SMH claim the leadership and outperform AMEX:HACK if this bull market continues.
In the last 2024 Bull market NASDAQ:SMH significantly outperformed the $HACK. We are probably in the early days of this breakout outperformance. So. In my opinion in the near term NASDAQ:SMH outperforms $HACK. The ratio is at 96%. The ratio might touch the previous cycle highs of 160% if the momentum continues.
Verdict: NASDAQ:SMH outperforms AMEX:HACK in near term. Buy NASDAQ:SMH ; Hold AMEX:HACK

$HACK and $SMH : The road to outperformanceHere in this space, we regularly check on the 2 subsectors i.e. Semis and Cybersecurity within the broader Tech sector. NASDAQ:SMH and AMEX:HACK have always outperformed the broader Tech sector ETF $XLK. During the last couple of quarters, we have seen the Cybersecurity sector has shown relative outperformance in comparison to the Semiconductor subsector within the technology index. When the NASDAQ:SMH lost more than 37% of its value during the recent downturn, while AMEX:HACK only lost 25% of its value. IN this blog space we have time and again focused on the topic of intrasector rotation. On 15th April I told you guys that the ratio chart of NASDAQ:SMH / AMEX:HACK looks overdone, and we might be set up for a reversal.
With both the sectors off of their local lows we can see that there is potential upside in both the sectors. But the question comes which one will outperform the other and if both of then outperform the broader index $XLK.
As I opined on 15th of April NASDAQ:SMH looks to have a higher BETA from its lows in comparison to $HACK. In the last downturns we have seen from its lows of 2022 NASDAQ:SMH 3Xed its price and AMEX:HACK 2X in the same time period. So, if you are looking for relative outperformance in the near to medium term then we should rather LONG NASDAQ:SMH over $HACK. And both NASDAQ:SMH and AMEX:HACK will outperform the AMEX:XLK in the near to long term.
Verdict : Long NASDAQ:SMH and $HACK. Overweight $SMH. Sell $XLK.

SOY 2024 - HACK Monthly Seasonality Stats
The chart shows the historical monthly returns for a set of years from 2015 to 2024. It highlights the volatility and seasonal trends across each year, with various months showing different performance patterns. For instance, January and February often see negative returns, with January showing a consistent trend of losses in 2015, 2016, and 2022, but more positive returns in other years like 2017 and 2019. March has historically been a more favorable month, showing generally positive returns in most years, while April, May, and November exhibit stronger growth patterns in many of the years analyzed. Notably, the summer months (June, July, and August) tend to show mixed results, with July sometimes experiencing strong performance but August and June showing more volatility. September is typically a weak month for returns, and October's performance can be unpredictable, fluctuating between gains and losses. December tends to be positive for most years, with the exception of 2015 and 2016, offering a year-end rally in several years. Overall, the chart provides insights into how specific months influence returns and highlights the potential for different investment strategies based on these seasonal trends.

HACK to long ?HUCK - Amplify Cybersecurity ETF + Cup & Handle patterns + Above the average line 150. Only an idea and not a recommendation for trading

$HACK: Cybersecurity is a good position to haveI like the idea of keeping 10% in this ETF, and periodically selling calls OTM each month as a way to generate extra yield on the capital allocated to it.
The recent Vulkan Files leak might serve as a short term catalyst, but the technicals were already favoring strong upside from this base before, and broad market conditions favor a bull market resurgence.
Best of luck!
Cheers,
Ivan Labrie.

Head-and-Shoulders Pattern Confirmed in CybersecurityCybersecurity has been one of the hottest industries in the US stock markets in 2020-2021. Stocks like Crowdstrike (CRWD), Palo Alto Networks (PANW), Zscaler (ZS), Fortinet (FTNT) and SentinelOne (S) have been innovative disruptors reshaping the cybersecurity arena. I have been a fan of many of these outstanding firms, their growth prospects, and technology.
But a Head and Shoulders pattern has appeared in HACK, an ETF that tracks the cybersecurity subsector. The pattern was confirmed on January 18, 2022 with a downside breakout followed by a whipsaw higher along with stock markets that lasted into mid-February. But the whipsaw rally failed—note the weekly candle for February with a bearish structure: one has a long upper wick and a close near lows (week of Feb. 7) and the other has a significant upper wick and a close near lows (week of Feb. 14). So it appears that the rally was a whipsaw that reversed the breakout direction temporarily.
A head and shoulders uses the maximum distance from the head's peak to the neckline to project a target from the breakout point. Doing so here, a target can be established approximately 17% lower than the breakout point, which is about 13.54% lower than the weekly close on Friday, Feb. 18, 2022.
Perhaps after more selling occurs, the group will carve out a bottom that provides a constructive entry point for long-term buy and hold strategies for companies in this group.
The ADX and Stochastics are both confirming of the bearish chart patterns. The ADX reveals a strongly trending price for HACK, with -DI rising again after a brief pullback. and Stochastics on a weekly basis are plainly trending below the 70 level, with bounces failing around 30 or lower, which indicates a strong downtrend.

$HACK Entering Breakout ModeVery nice breakout on volume for this security related ETF. The $60 level would probably act as a bit of resistance. A pull back to $58-$57.50 area would offer a nice R/R entry. Worth keeping an eye on.

ABC BullishPossible stop under C.
The simple ABC correction is a measured move down chart pattern nested inside a measured move up. In this correction pattern, C can not below A. If it does, you are looking at a different pattern. If C is equal to A then you may have a double bottom. D is the target and it is possible that AB can equal CD, but leg CD can also be extensions of the AB leg. Don't take anything for granted. Targets are calculated using the AB leg and fib levels. Long entry is a break of the BC leg with an uptrend. Not a recommendation.
Mindset can be the key to being successful. Panic can be your enemy. Keep you trading plan close by. Mine includes my targets, my exit strategy in case of a loss, entry level which can require patience, and the reason I bought the security. No reason to panic as your plan is right beside you (o:
Top 10 Holdings:
Cisco Systems Inc
Fortinet Inc
Akamai Technologies Inc
Cloudflare Inc
Qualys Inc
CACI International Inc Class A
Parsons Corp
Proofpoint Inc
ETFMG Sit Ultra Short ETF
Juniper Networks Inc


4 ETF PORTFOLIO FOR LONG-TERM GROWTH4 ETF's to buy and hold for Long-term growth:
$HACK - Cyber Security ETF
$QCLN - Clean Energy ETF
$QQQ - Large US Company ETF
$FDIS - Consumer Discretionary ETF

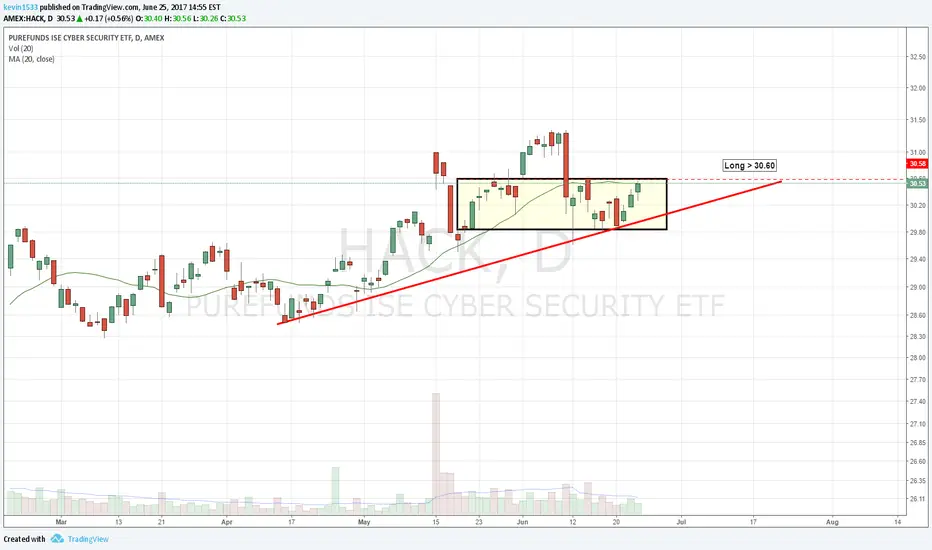
Cup and HandleCyber security ETF
Top 10 Holdings
CSCO - Cisco Systems Inc3.72%
VALT - ETFMG Sit Ultra Short ETF3.40%
NET - Cloudflare Inc3.16%
SPLK - Splunk Inc3.10%
PANW - Palo Alto Networks Inc2.86%
FTNT - Fortinet Inc2.84%
AKAM - Akamai Technologies Inc2.83%
SAIL - SailPoint Technologies Holdings Inc2.80%
PING - Ping Identity Holding Corp Ordinary Shares2.73%
AVST - Avast PLC2.72%
Not a recommendation

HACK CYBER SECURITY ETF POISED FOR A MAJOR BREAKOUTIf you are at all concerned about cyber security in the fast changing
and some say extremely dangerous global communications world
we are living in today, then why not invest now
in the companies that are trying to fight off malicious acts of terrorism
and safeguard our critical infrastructure and financially secure networks
here in the United States, and the across the world.
Prime Securities HACK ETF is a basket of 47 worldwide companies,
leading that line of defense, with 76 % of those companies located right here in the United States.
Chart pattern on HACK shows the potentially bullish inverse Head and Shoulder's Pattern,
seen building in many indices and stocks at this writing.
I think it's a very prudent idea to take a take a position in cyber security companies right now.
Allocate a small portion of your portfolio towards SECURITY. You will be glad you did.
It will only take one major global act of cyber warfare,
to skyrocket these security stocks,.. into the stratosphere.
HACK Last 36.23
THE_UNWIND
11/18/18
NEW YORK

Cybersecurity stocks strong when markets are down$HACK broke above the sma50 couple of days ago and today is green when major indexes are down. Good entry with 2ATR(14) stop.

HACK analysis for the upcoming weekHACK:
1) Long term Bullish, see weekly chart
2) Short term Bearich, but have bottomed out: Why
a) 50/50 RSI is about to cross from below upwards
b) Prices have break through the kumo-cloud
c) prices closed at the top 25% of range on 2 consecutive bar
d) Indicators are all labelled red
Action: I will go long when all of the following are lined up:
a) 50/50 RSI is about to cross from below upwards ...... DONE
b) Prices break through the kumo-cloud.................... DONE
c) prices closed at the top 25% of range ................... preferably but not ideal
d) Prices bars color change to green (this shows the beginning of an up trend) ....... NOT YET SEEN
e) The conversion line (green) above the base line (RED)...... NOT YET
f) Weekly chart is BUllish ....... DONE

$Hack Longi believe we are in a 5th wave of 2 degrees. Buy at 34.30-34.50 and hold to 39.00. this should play out over about 2.5 months at the longest.


Long Cyber SecurityAlthough I spend a predominant time with Technical Analysis, I believe the fundamentals will be strong for Cyber Security stocks. I will be going long this sector.

Bullish on Cybersecurity We are becoming more and more dependent on the internet. Along with this increased dependence the social desire for cyber defense will grow. Even at high costs the demand and necessity will be strong.
A single company will not monopolize security of the internet - it's too big and too complex - but I do think a broad index of companies building the "immune system of the internet" can benefit from this trend.
Supporting this trend are:
continued political cyber warfare & allegations lawfareblog.com
the release of CIA Hacking Tools ("zero day" exploits etc.) wikileaks.org
Hospital ransomware attacks - speaking to someone working in hospital data - hackers taking control of hospital data and holding it as ransom is more common than many of us are aware of. "The Federal Bureau of Investigation (FBI) reported a fourfold increase in ransomware attacks from 2015 to 2016. Those attacks resulted in a total of $1 billion being paid to hackers, the FBI said." medlineplus.gov
The Elliott Wave and technical analysis perspective:
Two cybersecurity ETFs $HACK & $CIBR have been trending in a bullish channel since 2015 and 2016 respectively, after tracing out a clear zigzag corrective patterns on long-term charts.
The two primary counts suggest further fifth wave upside at Intermediate or Minor degree.
The leading count is in red on the $HACK chart and depicted on the CIBR chart. Wave 3 is extended and wave 5 has begun tracing out the initial first and second waves.
The alternative count in blue on the $HACK charts illustrates an extended fifth wave in which Minute waves ((i)) and ((ii)) are complete and the initial first and second waves of wave ((iii)) of 5 are near complete suggesting a (iii) of ((iii)) of 5 spike is possible soon. $31.50 - $32.00 would be the first target zone.
RSI on $HACK is just shy of bullish territory and has been trending bullish with lower highs since February 2016.
Volume on $CIBR is trending up with higher highs suggest there is building strength for further upside.


HACK Weekly chartGreat ETF if you believe that cyber security is going to be big industry, I do. Things looking good on the weekly chart; if you look at the dailies there may be an entry position coming soon...

