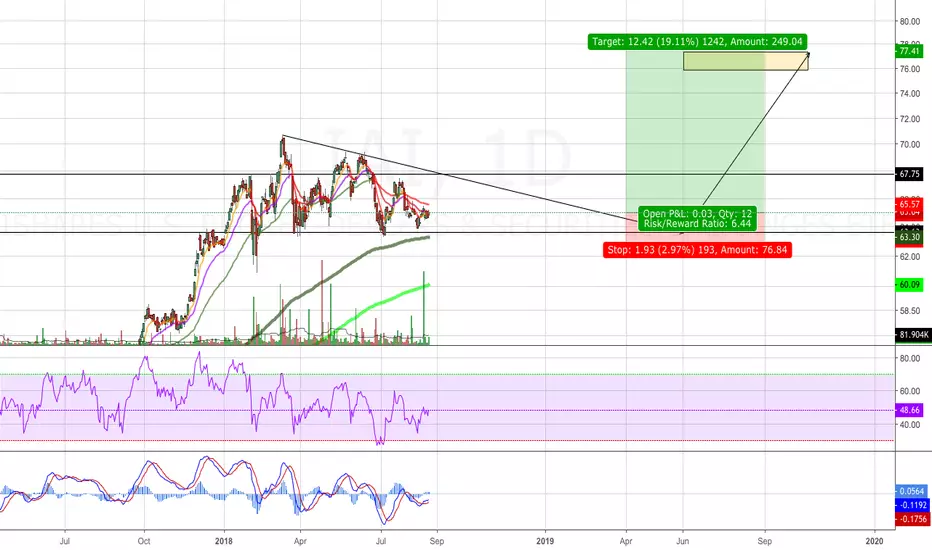
Broker-DealersIAI Outperforming S&P Financials ETF (XLF) - but IAI vs. SPY is still a ways away from being interpreted as bullish IMO
Key stats
About iShares U.S. Broker-Dealers & Securities Exchanges ETF
Home page
Inception date
May 1, 2006
Structure
Open-Ended Fund
Replication method
Physical
Dividend treatment
Distributes
Distribution tax treatment
Qualified dividends
Income tax type
Capital Gains
Max ST capital gains rate
39.60%
Max LT capital gains rate
20.00%
Primary advisor
BlackRock Fund Advisors
Distributor
BlackRock Investments LLC
IAI delivers a tight focus on one subset of the financial industry, only capturing US broker-dealers while excluding other sectors like banks and other financial institutions. The fund bypasses investment management firms as it focuses squarely on broker-dealers and trading firms. While its selection universe is smaller than our benchmark, the fund avoids fancy methodology and simply weights the portfolio by market-cap. A concentrated fund to begin with well over half of IAI's assets are held in its top holdings. The fund uses a sampling method and caps each company to 22.5%, while the aggregate weight of companies with greater than 4.5% are capped at 45% of the funds value. The fund undergoes quarterly rebalancing.
Related funds
Classification
What's in the fund
Exposure type
Finance
Commercial Services
Stock breakdown by region
Top 10 holdings

Broker-Dealers & Exchanges at an Inflection Point $IAIThis is one of the chart levels on our bull market checklist for premium subscribers. If B/D's & Exchanges remain below 57, we can't be long the space. This has been the strongest industry within Financials. If they lose leadership, look out below $XLF $IAI

iShares U.S. Broker-Dealers as a market barometeriShares U.S. Broker-Dealers as a market barometer ... looking for divergence between iai etf and spx index


This "market makers" ETF is very promisingiShares U.S. Broker-Dealers & Securities Exchanges ETF is about 10.7% GS, 9.9% MS and 8.8% SCHW -- I like it!
As you know the last years have been difficult for financials. But now inflation is rising and all of that stuff is going up. The underlyings discounted that already but I think we're up fo


See all ideas
Summarizing what the indicators are suggesting.
Oscillators
Neutral
SellBuy
Strong sellStrong buy
Strong sellSellNeutralBuyStrong buy
Oscillators
Neutral
SellBuy
Strong sellStrong buy
Strong sellSellNeutralBuyStrong buy
Summary
Neutral
SellBuy
Strong sellStrong buy
Strong sellSellNeutralBuyStrong buy
Summary
Neutral
SellBuy
Strong sellStrong buy
Strong sellSellNeutralBuyStrong buy
Summary
Neutral
SellBuy
Strong sellStrong buy
Strong sellSellNeutralBuyStrong buy
Moving Averages
Neutral
SellBuy
Strong sellStrong buy
Strong sellSellNeutralBuyStrong buy
Moving Averages
Neutral
SellBuy
Strong sellStrong buy
Strong sellSellNeutralBuyStrong buy
Displays a symbol's price movements over previous years to identify recurring trends.
Frequently Asked Questions
An exchange-traded fund (ETF) is a collection of assets (stocks, bonds, commodities, etc.) that track an underlying index and can be bought on an exchange like individual stocks.
IAI trades at 175.82 USD today, its price has risen 0.81% in the past 24 hours. Track more dynamics on IAI price chart.
IAI net asset value is 175.72 today — it's risen 5.72% over the past month. NAV represents the total value of the fund's assets less liabilities and serves as a gauge of the fund's performance.
IAI assets under management is 1.45 B USD. AUM is an important metric as it reflects the fund's size and can serve as a gauge of how successful the fund is in attracting investors, which, in its turn, can influence decision-making.
IAI price has risen by 6.87% over the last month, and its yearly performance shows a 44.91% increase. See more dynamics on IAI price chart.
NAV returns, another gauge of an ETF dynamics, have risen by 5.72% over the last month, showed a 26.82% increase in three-month performance and has increased by 46.46% in a year.
NAV returns, another gauge of an ETF dynamics, have risen by 5.72% over the last month, showed a 26.82% increase in three-month performance and has increased by 46.46% in a year.
IAI fund flows account for −198.97 M USD (1 year). Many traders use this metric to get insight into investors' sentiment and evaluate whether it's time to buy or sell the fund.
Since ETFs work like an individual stock, they can be bought and sold on exchanges (e.g. NASDAQ, NYSE, EURONEXT). As it happens with stocks, you need to select a brokerage to access trading. Explore our list of available brokers to find the one to help execute your strategies. Don't forget to do your research before getting to trading. Explore ETFs metrics in our ETF screener to find a reliable opportunity.
IAI invests in stocks. See more details in our Analysis section.
IAI expense ratio is 0.40%. It's an important metric for helping traders understand the fund's operating costs relative to assets and how expensive it would be to hold the fund.
No, IAI isn't leveraged, meaning it doesn't use borrowings or financial derivatives to magnify the performance of the underlying assets or index it follows.
In some ways, ETFs are safe investments, but in a broader sense, they're not safer than any other asset, so it's crucial to analyze a fund before investing. But if your research gives a vague answer, you can always refer to technical analysis.
Today, IAI technical analysis shows the buy rating and its 1-week rating is buy. Since market conditions are prone to changes, it's worth looking a bit further into the future — according to the 1-month rating IAI shows the strong buy signal. See more of IAI technicals for a more comprehensive analysis.
Today, IAI technical analysis shows the buy rating and its 1-week rating is buy. Since market conditions are prone to changes, it's worth looking a bit further into the future — according to the 1-month rating IAI shows the strong buy signal. See more of IAI technicals for a more comprehensive analysis.
Yes, IAI pays dividends to its holders with the dividend yield of 0.92%.
IAI trades at a premium (0.06%).
Premium/discount to NAV expresses the difference between the ETF’s price and its NAV value. A positive percentage indicates a premium, meaning the ETF trades at a higher price than the calculated NAV. Conversely, a negative percentage indicates a discount, suggesting the ETF trades at a lower price than NAV.
Premium/discount to NAV expresses the difference between the ETF’s price and its NAV value. A positive percentage indicates a premium, meaning the ETF trades at a higher price than the calculated NAV. Conversely, a negative percentage indicates a discount, suggesting the ETF trades at a lower price than NAV.
IAI shares are issued by BlackRock, Inc.
IAI follows the DJ US Select / Investment Services. ETFs usually track some benchmark seeking to replicate its performance and guide asset selection and objectives.
The fund started trading on May 1, 2006.
The fund's management style is passive, meaning it's aiming to replicate the performance of the underlying index by holding assets in the same proportions as the index. The goal is to match the index's returns.