IMO trade ideas

IMO: Ascending Triangle, not confirmed (59,64%)(24/1000)(24/1000)
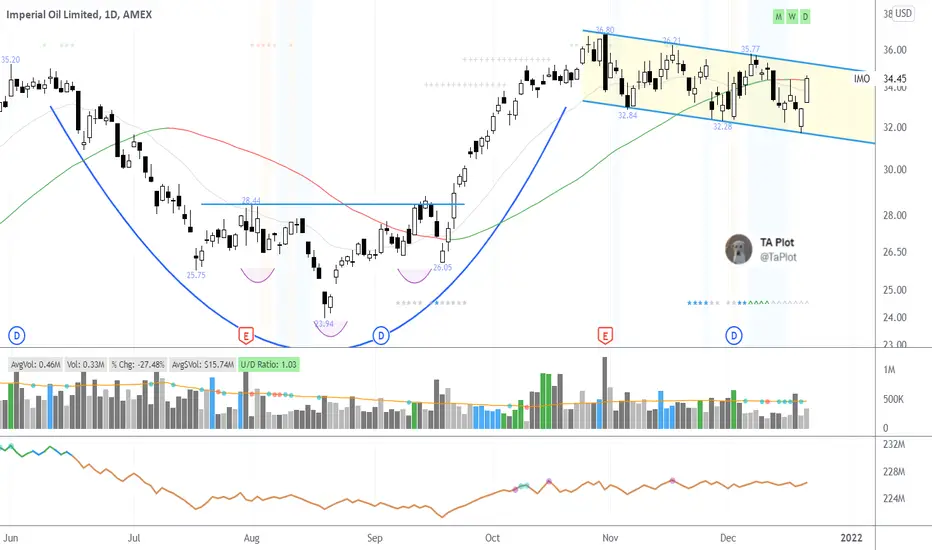
Ascending Triangle for IMO (chart on left)
Not confirmed.
Possible 59,64% gains.
This is solidified by the fact the SPN (energy sector, chart on right) is also building into an ascending triangle (not confirmed) with a possible 41,62% gain.
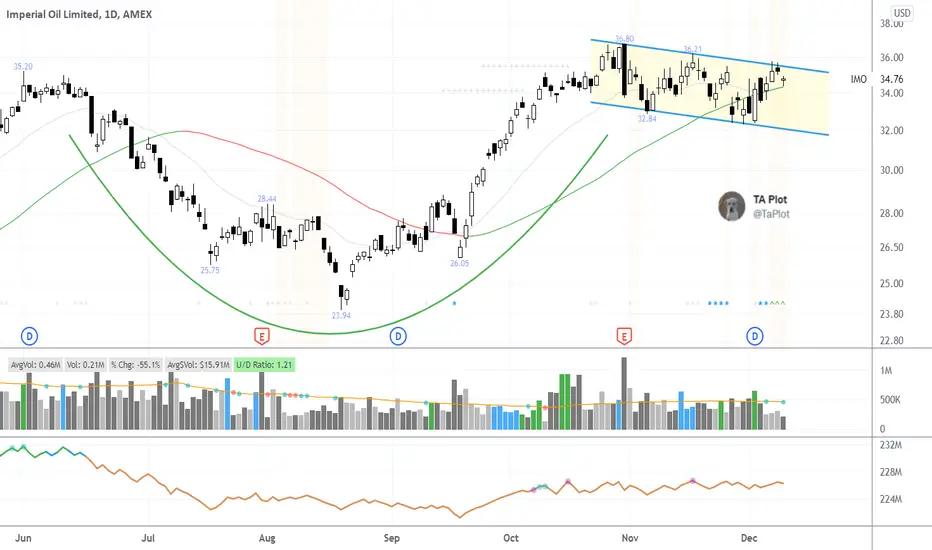
Now for the analysis of IMO:
Pros:
1- Bullish Ascending triangle
3- PPS above 50MA and 200MA
3- R/R ratio above 5
4- 250RSI above 50 and ascending
5- 50MA above 200MA
6- 50MA and 200MA ascending, though 200MA is not ascending by a lot
7- RS above 0 and ascending
8- Golden cross in blue
Cons:
1- Pattern Not confirmed yet. Waiting for the PPS to cross the resistance
2- Limited descending volume during formation
3- ATR descending, less volatile
IMO Target price is 92,67$.
Stay humble, have fun, make money!
MAAX!

$IMO with a Bullish outlook following its earnings #Stocks The PEAD projected a bullish outlook for $IMO after a Negative over reaction following its earnings release placing the stock in drift C with an expected accuracy of 71.43%.

IMO - double top patternWhat we can see on the chart is a double top pattern.
We expect that the price is going to move downwards, once it broke below the neckline you can enter short with a sell limit order.
Do not forget to put a stop loss above the double top to protect your capital.

$IMO with a Bullish outlook following its earnings #Stocks The PEAD projected a Bullish outlook for $IMO after a Positive Under reaction following its earnings release placing the stock in drift A.

IMO Strong Breakout to UpsideTwo big patterns can be identified on chart, one ascending one descending. Both are bullish.
Upon completion a large bull run ensues.
The previous chart pattern has just finished forming and breakout further up (green arrow) is occurring

$IMO with a Bearish outlook following its earnings #Stocks The PEAD projected a Bearish outlook for $IMO after a Positive over reaction following its earnings release placing the stock in drift B with an expected accuracy of 80%.

$IMO 7 Months Cup with HandlePretty neat chart on $IMO
*7 month coup w/ handle
*Cup base was a head & shoulders bottom
*Handle taking on the shape of a 2 months bull flag
Need to give us a tight pivot to anchor risk around.
Watching but Its not ready just yet.
$IMO 6 Months Cup with Handleanother on in the oil sector is $IMO with its 6 months cup and a handle in the shape of a bull flag. Making it to my primary list along side $DEN and $WLL
IMO - Poised for moveIMO is the best looking oil company chart that I could find. The weekly pattern shows the possibility of a three week test of the low. This support level includes the 40 week moving average and the .326 fib retracement level.
The wave structure suggests that we may be in the fourth wave of an impulse pattern, with wave five to begin soon. Often, wave five moves for commodities are the longest waves.
The trade range spans from 24 to 34. A longer term view shows that this trade range has persisted since 2015.
Beyond 34, the stock had reached as high as 63 and ran into the 50s two other times.
IMO's price correlates very well with the price of CL oil futures. I think that in the equity world, it might be the best choice to trade oil, in the equity market. I'm open to others' suggestions. What other oil stocks are you looking at?
I owned Exxon and Chevron until June when a move to turn Exxon green moved me to liquidate all oil shares. Since then, I have bought some RSX, a Russian market ETF. Seems that under the current administration, oil profits will accrue to Russia, Iran, Venezuela and Saudi Arabia.

IMO on watchSomewhat skeptical of Oil stocks but this sector seems to be perking up
Theory being that a potential Dem win = less oil production = higher prices for oil. IDK

IMO is heading upIMO was overbought but after this pullback it brought it to the middle of overbought and oversold. Which means it is heading up.
Shout-out to @maxim77788 for making my charts better by using RSI and Asfx TDI

Ugly Chart!So this chart is ugly. Lower highs and lower lows, but we are near the 10 year bottom in its price. I think with the peak dollar gearing up for weakening from Fed rate cuts we could see a higher oil price and alternatively a higher IMO stock. Gearing up to open a position of 1.5% to 3% on oversold days.


IMO - Downward channel breakout long, also oil hedge playIMO nicely breaking out downward channel formation. It looking very good as Oil hedge play.
* Trade Criteria *
Date First Found- June 19, 2017
Pattern/Why- Downward channel breakout
Entry Target Criteria- current price
Exit Target Criteria- N/A
Stop Loss Criteria- $28.67
Please check back for Trade updates. (Note: Trade update is little delayed here.)

Short Term Upward MobilityCurrently close to one year low. Expect ceiling level CAD $ 44 -45 in half a year


