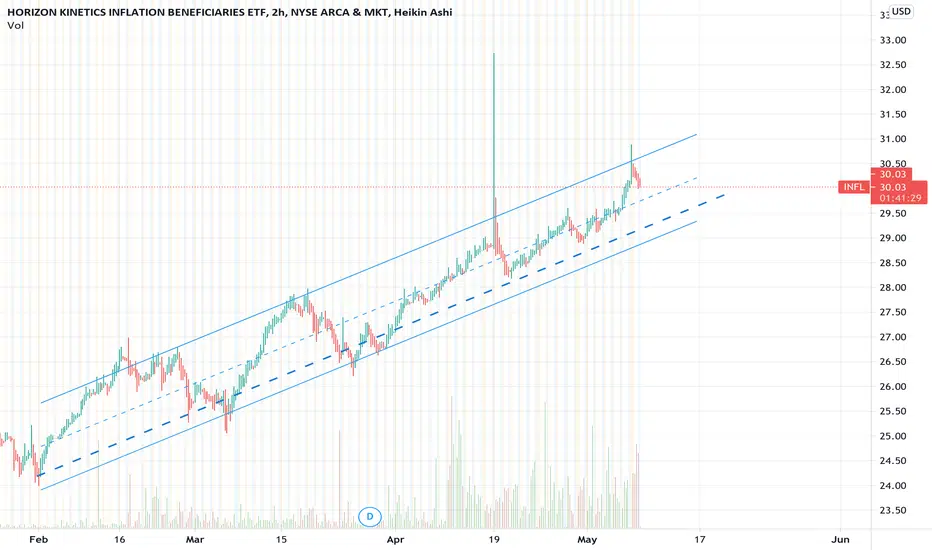
$INFL Breaking Out of Darvas BoxBeside breaking out here, this ETF is an inflation play. I encourage you to "Google" the symbol and check out it's holdings. As with all my ideas, I am not making any recommendation to buy or sell. Please do your own due diligence.
Key stats
About Horizon Kinetics Inflation Beneficiaries ETF
Home page
Inception date
Jan 11, 2021
Structure
Open-Ended Fund
Replication method
Physical
Dividend treatment
Distributes
Distribution tax treatment
Qualified dividends
Income tax type
Capital Gains
Max ST capital gains rate
39.60%
Max LT capital gains rate
20.00%
Primary advisor
Horizon Kinetics Asset Management LLC
Distributor
Foreside Fund Services LLC
INFL is Horizon Kinetics first ETF launch, with an exposure to global companies expected to be inflation beneficiaries (typically those that can increase revenue without a corresponding increase in expenses in an inflationary environment). Such companies may include: exploration and production companies, mining companies, transportation companies, infrastructure and real estate companies (with an emphasis on asset light businesses with royalty, streaming, rental, brokerage, management, and leasing exposure). INFL may also have significant exposure to securities exchange companies. The funds portfolio will comprise of approximately 20-60 issuers of any market capitalization, and its investments will generally include common stocks, ownership units of publicly traded MLPs (including general and limited partnership interests), as well as units of royalty trusts.
Related funds
Classification
What's in the fund
Exposure type
Finance
Non-Energy Minerals
Miscellaneous
Stock breakdown by region
Top 10 holdings


Summarizing what the indicators are suggesting.
Oscillators
Neutral
SellBuy
Strong sellStrong buy
Strong sellSellNeutralBuyStrong buy
Oscillators
Neutral
SellBuy
Strong sellStrong buy
Strong sellSellNeutralBuyStrong buy
Summary
Neutral
SellBuy
Strong sellStrong buy
Strong sellSellNeutralBuyStrong buy
Summary
Neutral
SellBuy
Strong sellStrong buy
Strong sellSellNeutralBuyStrong buy
Summary
Neutral
SellBuy
Strong sellStrong buy
Strong sellSellNeutralBuyStrong buy
Moving Averages
Neutral
SellBuy
Strong sellStrong buy
Strong sellSellNeutralBuyStrong buy
Moving Averages
Neutral
SellBuy
Strong sellStrong buy
Strong sellSellNeutralBuyStrong buy
Displays a symbol's price movements over previous years to identify recurring trends.
Frequently Asked Questions
An exchange-traded fund (ETF) is a collection of assets (stocks, bonds, commodities, etc.) that track an underlying index and can be bought on an exchange like individual stocks.
INFL trades at 41.75 USD today, its price has fallen −0.81% in the past 24 hours. Track more dynamics on INFL price chart.
INFL net asset value is 41.76 today — it's fallen 0.75% over the past month. NAV represents the total value of the fund's assets less liabilities and serves as a gauge of the fund's performance.
INFL assets under management is 1.26 B USD. AUM is an important metric as it reflects the fund's size and can serve as a gauge of how successful the fund is in attracting investors, which, in its turn, can influence decision-making.
INFL price has fallen by −1.62% over the last month, and its yearly performance shows a 21.60% increase. See more dynamics on INFL price chart.
NAV returns, another gauge of an ETF dynamics, have risen by −0.75% over the last month, have fallen by −0.75% over the last month, showed a 16.14% increase in three-month performance and has increased by 23.77% in a year.
NAV returns, another gauge of an ETF dynamics, have risen by −0.75% over the last month, have fallen by −0.75% over the last month, showed a 16.14% increase in three-month performance and has increased by 23.77% in a year.
INFL fund flows account for 294.48 M USD (1 year). Many traders use this metric to get insight into investors' sentiment and evaluate whether it's time to buy or sell the fund.
Since ETFs work like an individual stock, they can be bought and sold on exchanges (e.g. NASDAQ, NYSE, EURONEXT). As it happens with stocks, you need to select a brokerage to access trading. Explore our list of available brokers to find the one to help execute your strategies. Don't forget to do your research before getting to trading. Explore ETFs metrics in our ETF screener to find a reliable opportunity.
INFL invests in stocks. See more details in our Analysis section.
INFL expense ratio is 0.85%. It's an important metric for helping traders understand the fund's operating costs relative to assets and how expensive it would be to hold the fund.
No, INFL isn't leveraged, meaning it doesn't use borrowings or financial derivatives to magnify the performance of the underlying assets or index it follows.
In some ways, ETFs are safe investments, but in a broader sense, they're not safer than any other asset, so it's crucial to analyze a fund before investing. But if your research gives a vague answer, you can always refer to technical analysis.
Today, INFL technical analysis shows the sell rating and its 1-week rating is buy. Since market conditions are prone to changes, it's worth looking a bit further into the future — according to the 1-month rating INFL shows the buy signal. See more of INFL technicals for a more comprehensive analysis.
Today, INFL technical analysis shows the sell rating and its 1-week rating is buy. Since market conditions are prone to changes, it's worth looking a bit further into the future — according to the 1-month rating INFL shows the buy signal. See more of INFL technicals for a more comprehensive analysis.
Yes, INFL pays dividends to its holders with the dividend yield of 1.77%.
INFL trades at a premium (0.05%).
Premium/discount to NAV expresses the difference between the ETF’s price and its NAV value. A positive percentage indicates a premium, meaning the ETF trades at a higher price than the calculated NAV. Conversely, a negative percentage indicates a discount, suggesting the ETF trades at a lower price than NAV.
Premium/discount to NAV expresses the difference between the ETF’s price and its NAV value. A positive percentage indicates a premium, meaning the ETF trades at a higher price than the calculated NAV. Conversely, a negative percentage indicates a discount, suggesting the ETF trades at a lower price than NAV.
INFL shares are issued by Horizon Kinetics Holding Corp.
INFL follows the No Underlying Index. ETFs usually track some benchmark seeking to replicate its performance and guide asset selection and objectives.
The fund started trading on Jan 11, 2021.
The fund's management style is active, aiming to outperform its benchmark index by actively selecting and adjusting assets. The goal is to achieve returns that exceed those of the index the fund tracks.