Are babies on the move?Micro-caps = are like real babies they are just starting to walk and talk all of them full of potential
Pros for a large upward move
1)FED peak rates
2)10y% lower = risk on
3)Soft landing
4)Inflation is behind (for now...)
5)Heading into elections historically market goes up and babies should too as
Key stats
About iShares Microcap ETF
Home page
Inception date
Aug 12, 2005
Structure
Open-Ended Fund
Replication method
Physical
Dividend treatment
Distributes
Distribution tax treatment
Qualified dividends
Income tax type
Capital Gains
Max ST capital gains rate
39.60%
Max LT capital gains rate
20.00%
Primary advisor
BlackRock Fund Advisors
Distributor
BlackRock Investments LLC
IWC takes a plain vanilla, market-cap-weighted view of the micro-cap segment. The underlying index selects 1000 of the smallest from the Russell 2000 Index. From our perspective, however, it skews large, putting a lot of weight in companies we consider small-caps. Its beta indicates that the fund is relatively volatile compared with the broad US micro-cap market. Still, it provides decent coverage of the space overall. Holdings costs are likely to be lower than the stated expense ratio, thanks to smart portfolio management that tends to recover a sizeable chunk. A solid choice for this hard to reach area of the market.
Related funds
Classification
What's in the fund
Exposure type
Finance
Health Technology
Stock breakdown by region
Top 10 holdings

$IWC Micro Cap Analysis Here's my take on the AMEX:IWC Microcap ETF. The micro cap ETF is bouncing off the bottom end of a regression channel, however a warning signal is that it's still below an area of resistance. You can see that on that area it used to be a prior support but it has since been broken. As you know pri
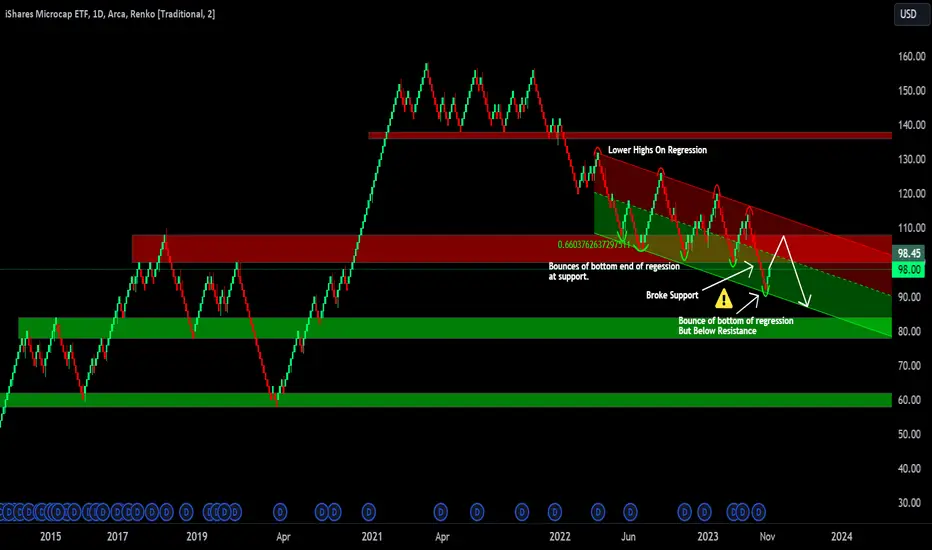
IWC$90 is the support level for micro caps. Based on the other areas of the market, we could see a bounce around the $90 level but will probably see IWC break below $90

$qqq vs $iwc What are your thoughts on QQQ hereI would say I would rather be an owner of IWC over QQQ. This could get ugly for QQQ if IWC breaks lower.

IWC - Nested 1-2, explosive wave 3 setting up.As with all indexes, the last squeeze before crashing into the end of the year.

Risk AppetiteRatio between IWC ( Microcap ETF ) and DIA ( Mega Cap) - picked this up from a presentation by Gundlach of Doubleline Funds. A good gauge of risk appetite. You can clearly see the blow off in Nov 20, Last Hurrah in Nov 21 and where we are now.

Re-test of Aug 2018/ Oct 2020 Acummulation Range CreekAfter breaking the near-term Accumulation/Distribution Range Ice to the downside, Path of least resistance is a retest of the Previous Accumulation Range Creek (Origin of Breakout) before continuing the Uptrend.
Distribution Range Breakdown 261.8% Measured Move Target @ 94.20

IWC Next Rhombing Flag or Short Term Double BottomTwo Legs Sideways to Down objective met.
05 Mar 2021 to 18 Jan 2022 Big Picture Distribution Range breakdown Black Swan Measured Move 1:1 Target @ 108.75
Short term Double Bottom for a Simple Corrective WXY or Complex WXYXZ before Downtrend Continuation.

US Micro-Cap Breaking Out?Here in this position, it is clear that intensive work has gone into supporting the entire global recovery.
Moreover, we could already count the resilience in credit as ideal results from the covid siege. But now I want to focus on the US and small caps in particular are getting to work and th


See all ideas
Summarizing what the indicators are suggesting.
Oscillators
Neutral
SellBuy
Strong sellStrong buy
Strong sellSellNeutralBuyStrong buy
Oscillators
Neutral
SellBuy
Strong sellStrong buy
Strong sellSellNeutralBuyStrong buy
Summary
Neutral
SellBuy
Strong sellStrong buy
Strong sellSellNeutralBuyStrong buy
Summary
Neutral
SellBuy
Strong sellStrong buy
Strong sellSellNeutralBuyStrong buy
Summary
Neutral
SellBuy
Strong sellStrong buy
Strong sellSellNeutralBuyStrong buy
Moving Averages
Neutral
SellBuy
Strong sellStrong buy
Strong sellSellNeutralBuyStrong buy
Moving Averages
Neutral
SellBuy
Strong sellStrong buy
Strong sellSellNeutralBuyStrong buy
Displays a symbol's price movements over previous years to identify recurring trends.
Frequently Asked Questions
An exchange-traded fund (ETF) is a collection of assets (stocks, bonds, commodities, etc.) that track an underlying index and can be bought on an exchange like individual stocks.
IWC trades at 127.86 USD today, its price has fallen −1.99% in the past 24 hours. Track more dynamics on IWC price chart.
IWC net asset value is 130.48 today — it's risen 2.07% over the past month. NAV represents the total value of the fund's assets less liabilities and serves as a gauge of the fund's performance.
IWC assets under management is 839.57 M USD. AUM is an important metric as it reflects the fund's size and can serve as a gauge of how successful the fund is in attracting investors, which, in its turn, can influence decision-making.
IWC price has fallen by −0.87% over the last month, and its yearly performance shows a −0.43% decrease. See more dynamics on IWC price chart.
NAV returns, another gauge of an ETF dynamics, showed a 17.62% increase in three-month performance and has increased by 3.94% in a year.
NAV returns, another gauge of an ETF dynamics, showed a 17.62% increase in three-month performance and has increased by 3.94% in a year.
IWC fund flows account for −94.18 M USD (1 year). Many traders use this metric to get insight into investors' sentiment and evaluate whether it's time to buy or sell the fund.
Since ETFs work like an individual stock, they can be bought and sold on exchanges (e.g. NASDAQ, NYSE, EURONEXT). As it happens with stocks, you need to select a brokerage to access trading. Explore our list of available brokers to find the one to help execute your strategies. Don't forget to do your research before getting to trading. Explore ETFs metrics in our ETF screener to find a reliable opportunity.
IWC invests in stocks. See more details in our Analysis section.
IWC expense ratio is 0.60%. It's an important metric for helping traders understand the fund's operating costs relative to assets and how expensive it would be to hold the fund.
No, IWC isn't leveraged, meaning it doesn't use borrowings or financial derivatives to magnify the performance of the underlying assets or index it follows.
In some ways, ETFs are safe investments, but in a broader sense, they're not safer than any other asset, so it's crucial to analyze a fund before investing. But if your research gives a vague answer, you can always refer to technical analysis.
Today, IWC technical analysis shows the sell rating and its 1-week rating is buy. Since market conditions are prone to changes, it's worth looking a bit further into the future — according to the 1-month rating IWC shows the buy signal. See more of IWC technicals for a more comprehensive analysis.
Today, IWC technical analysis shows the sell rating and its 1-week rating is buy. Since market conditions are prone to changes, it's worth looking a bit further into the future — according to the 1-month rating IWC shows the buy signal. See more of IWC technicals for a more comprehensive analysis.
Yes, IWC pays dividends to its holders with the dividend yield of 1.07%.
IWC trades at a premium (0.09%).
Premium/discount to NAV expresses the difference between the ETF’s price and its NAV value. A positive percentage indicates a premium, meaning the ETF trades at a higher price than the calculated NAV. Conversely, a negative percentage indicates a discount, suggesting the ETF trades at a lower price than NAV.
Premium/discount to NAV expresses the difference between the ETF’s price and its NAV value. A positive percentage indicates a premium, meaning the ETF trades at a higher price than the calculated NAV. Conversely, a negative percentage indicates a discount, suggesting the ETF trades at a lower price than NAV.
IWC shares are issued by BlackRock, Inc.
IWC follows the Russell Microcap. ETFs usually track some benchmark seeking to replicate its performance and guide asset selection and objectives.
The fund started trading on Aug 12, 2005.
The fund's management style is passive, meaning it's aiming to replicate the performance of the underlying index by holding assets in the same proportions as the index. The goal is to match the index's returns.