IWM trade ideas

IWM BULLISH PROJECTION 2024This is a bullish projection for the IWM in 2024.
IWM may retest the GAP around 180 and make a breakup.

IWM 5 waves DOWN wave 1 of 5 of C of CRASH CYCLEI have down ended 5 waves down .We should now see a rally back to 198/199.6 for wave 2 . This should also see the sp 500 print of 4821 min and the dji into 38200/38400 SUPER CYCLE TOP
IwmHuge double bottom forming off off support here..
1st target is 197 gap close
2nd target is 200 gap close
Might go higher lets see what happens

iShares Russell 2000 ETF - Waiting for a better opportunity iShares Russell 200 - AMEX:IWM
I'd be waiting for an opening
▫️ Break above overhead resistance
▫️ Bounce off the base support
▫️ Min 200 week MA bounce (tight stop).
A wait and see from me
🚨Declining On Balance Volume (OBV) not ideal.
✅Upward sloping 200 week is a positive

Bearish Outlook for Russell 2000 IWMSigns of bears waking up on this one. 2-4 line brake with VI flipping a few days ago. Significant for high chance of trend reversal. RVI gaining momentum in the negative. This scenario also fits greater channel confines that IWM has been obeying for months. Could be a start of a downward ?A/X wave.
We are not in the business of getting every prediction right, no one ever does and that is not the aim of the game. The Fibonacci targets are highlighted in green or purple (short positions) with invalidation in red. Confirmation level, where relevant, is a pink dotted, finite line. Fibonacci goals, it is prudent to suggest, are nothing more than mere fractally evident and therefore statistically likely levels that the market will go to. Having said that, the market will always do what it wants and always has a mind of its own. Therefore, none of this is financial advice, so do your own research and rely only on your own analysis. Trading is a true one man sport. Good luck out there and stay safe.

IWM - Pullback RetraceIWM is looking to break the downtrend from the recent pullback. Looking for a retrace to 199 - 201 range.

$IWM - Failed breakoutAMEX:IWM couldn't break through the sideways consolidation channel. If $195 couldn't be reclaimed soon, it could see further downside.
Downside Targets:
$188
$183 (Critical support)
The $183 area is critical support because it concurs with both the neckline support of the previous head and shoulders (H&S) pattern and the 50% Fibonacci retracement level.
I will update the chart when I see a reversal.

Short IWM@mchuac88 vol of vol and Vixfix trending upwards. Highly bearish, but be aware of position at the risk range

IWM: Week of Jan 8thPer request, here is IWM.
My immediate TP for IWM is a move to 189, which is PL2 on the month.
There is where I would look to get long:
ARIMA has IWM as down-trending into next week and I concur with this assessment.
189 is also within the low range forecasted for next week.
IWM has a similar setup to SPY on the weekly via Heikin Ashi:
But we do have some bullish upside on the horizon judging by the daily:
Again, timelines are wishy washy with all of this, its a matter of waiting for whichever setup comes first.
As of now, imo, the setup is short to 189 and then, provided this level holds, a long for a bounce.
We will see how it plays out next week, we do have that GT on the month as with SPY. I am curious how this is all going to unfold.
Those are my thoughts on IWM!
If you have any ticker you are interested in and want me to cover for next week, leave a comment and I will make a point of going over it!
Thanks all,
Safe trades :-)

IWM - Shot Put - Feb16 '24 Happy New Year!
After a strong Christmas rally, the market is in a correction.
The trend is still up unless the market tells us otherwise.
Yesterday, I opened new Positions in IWM.
I expect the upward trend to continue after breakout at $198. With a short put I would like to participate in an upward movement.
Facts:
Short Put - $188
Credit: $1,75
45 DTE - Feb16 '24
IVR: 34 with historical IV above 20%
best regards
toni

IWM testing demand zoneResistance at $204, downside areas for a bounce $198 - $197 if we fail to bounce at the demand zone.


IWM - Russell 2000 - SHORT (Wyckoff Re-Distribution)IWM looks to be reaching the UTAD stage of a Wyckoff Re-distribution schematic.
Lowering volume in the lead up to UTAD provides confluence to the idea. Expecting price to return to linear regression trend line around 120. Price could extend further, but I expect we are nearing the top of this rally and a sharp correction in 2024.
Take profit level of 120 coincides with a fibo extension of 1.618, so further confluence there.
Markets are overinflated and this move would revert price back to the long term mean.

IWM: A $240 Target in 2024. Here's Why It's Doable.Flip on financial TV and you will likely hear a plethora of sellside strategists and buyside portfolio managers voice optimism about small-cap US stocks. Consider that the iShares Russell 2000 ETF (IWM) was easily in negative territory on the year back in October. Fast forward just two months and the small-cap ETF is up close to 20% total return in 2023. The quick switch has come about amid the group’s fastest move from a 52-week low to a 52-week high in its history. IWM is now poised to print its third-best two-month rally since its inception more than 20 years ago.
Is there more room to run? I think so. A breakout above the $200 mark, particularly on a weekly, monthly, and yes, even a yearly closing basis, is significant. Recall that IWM found support in the low $160s on a few occasions in the last year and a half after printing an all-time high above $240 in November 2021. Sellers flexed their muscles three separate times in 2022 and 2023 at the $200 mark. This $40 zone appears to be breaking in the bulls’ favor. That suggests a measured move upside target to $240 – close to the all-time high on IWM.
I see some near-term resistance in the $210 to $215 area – the range lows from 2021. Indeed, there is likely a significant amount of ‘dead bodies’ lingering above $210 that may look to supply the market with shares in order to sell at the breakeven mark. Still, the technicals appear positive despite some near-term overbought readings on IWM. Another cautionary signal is that the January through mid-March stretch has featured some volatility at times for the broad market, so the pace of the advance will likely slow. I remain constructive on small caps looking into 2024, though.

IWM Grinding at ResistanceInverse to the TNA idea I just shared. IWM is currently trying to flip long term resistance to support. Important spot for both bulls and bears, as we see if the small cap rally lives on or if we start to see a reversal here.

$IWM 2023 In ReviewLooking back at 2023, AMEX:IWM shows very clearly the 3 opportunities this year provided on the long side (for my style of trading).
To use the words of @Zeninthemarkets Scott from #IBD
* Green Zone = "Market on the Give"
* Red Zone = "Market on the Take"

Nasdaq Highest Weekly close The markets marched higher here for an 8th consecutive week.
this is the largest rally since 2017!
The Nasdaq closed the week at its highest ever weekly close.

Small caps hitting the wall vs. goldWhile the small caps have provided fuel for a bull run in stocks to close 2023, they look to be running on empty when priced in gold.
Since breaking down in late 2021, the Russell 2000 has previously tested the Ichimoku cloud 3 times, swiftly bouncing downward on each attempt. In tandem with price, momentum has been rejected by a resistance level of 60% on the RSI chart.
Both indicators now are recurring, with momentum flattening at horizontal resistance and a doji reversal candle forming at the top of the Ichimoku cloud. While the Russell may continue to run in nominal terms going into the new year, its real value looks to roll over and continue into a secular downtrend.

IWM Massive reversal! CVNA / UPST / AFRMShort Squeeze stocks finally ended their epic rally!
Could High beta stocks be signaling a turn in the market?

$IWM Breaking Resistance Peek-a-boo ... AMEX:IWM breaking through is $200 Overhead Supply level ... next stop .... ????

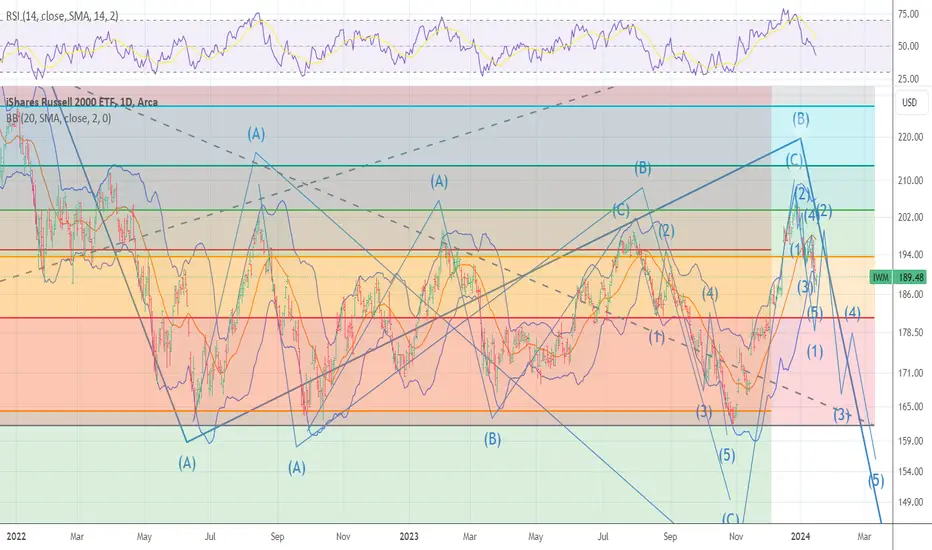
IWM TARGET 213./214 .618 WAVE B TOP The chart is the IWM back in late oct I talked about a target at 161.8 and how it must hold as well as the IYT having to hold 209.6 . We held both So are we in the start of a NEW BULL MARKET . I will say No until we break above 216 I see the pattern like that of 1987 in which we had a large abc rally in the dow and sp 500 in fact the wave A up peaked at 50 % and then we dropped to a minor new low and then saw a 5 wave rally in which EVERYONE SAID ALL CLEAR and it peaked at .618 from there we saw the CRASH . I will maintain The market peaked in dec 2021 What would change my view simple break above the fib relationship in 5 waves and then pullback into march in an A B C decline . Lower interest rates Is NOT good for the market it is a sight of under lying weakest see chart of fed pivot

$IWM $145 before $400+?I know everyone is getting excited about IWM as it's rallied a lot over the last couple of months, but I think it'll face some pain in the coming weeks before it really starts to outperform.
I am of the mindset that everything has it's cycle and I do think that going into the next bull market, that QQQ and SPY will underperform relative to IWM.
That said, I think IWM will have a 25% correction before the bull market really begins. However after that happens, I think IWM will go to hit new highs and top around $400 sometime in 2025-2026.
Support = $145
Resistance = ~$400
